
“It ain’t what you don’t know that gets you into trouble. It’s what you know for sure that just ain’t so.” Mark Twain
Definition
Dictionaries have a range of broadly related definitions, mostly suggesting the mathematical meaning and everyday sense are identical. As we saw with the word “significance” https://appliedmacro.com/2017/06/12/the-misuse-of-significance/, when there is no clear distinction in statistical and everyday usage, it can lead directly to confusion and often dangerous errors.
A few meanings:
- Historical origin of the word is likely from medieval Latin:

- Modern common usage, it is “a mutual relationship or connection between two things”
- In statistics, it broadly means a “quantity measuring the interdependence of variable quantities”.
- Here a difficulty arises, as although statistics has this broad meaning for it, often (especially in economics or finance) when people say correlation, they are talking about the Pearson Correlation Coefficient, also referred to as Pearson’s r.
- Person’s r is the formula I gave you in the previous posts (https://appliedmacro.com/2017/06/28/the-misuse-of-correlation-part-1-quick-refresher-and-quiz/) and is specifically a measure of linear correlation between two variables.
It has a value between +1 and −1, where 1 is perfect positive linear correlation, 0 is no linear correlation, and −1 is perfect negative linear correlation.
Issues
I would like to deal with well-known issues that still lead to common mistakes.
- Uncorrelated does not mean unrelated
- Correlation does not imply causation
- Correlation is not transitive
- Data issues
I’ll deal with the first two in the remainder of this post, and the second two in the following, to keep the posts to a reasonable length.
- Uncorrelated does not mean unrelated
Saying things are uncorrelated, people generally mean there is no relationship between them in everyday usage. Let’s look at a couple of examples where this common logic error leads to dangerously incorrect conclusions:
A). Relationships can be non-linear
When a cannonball is fired, its path will form a parabola (OK strictly only in a vacuum!). If we look for a relationship between height and time, draw a chart then the relationship is very clear.
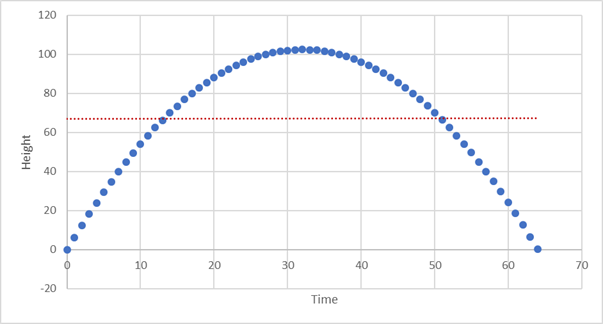
If we ran a Pearson r correlation analysis instead of drawing the picture, we would find there is ZERO correlation between height and time. Other statistical correlation measures, such Spearman’s rho which looks for monocity may pick up non-linear monotonic relationships, but also will not help you here for a parabolic relationship.
If you are using a statistical analysis early on in your investigations, the absence of a measurable correlation, such as a linear one, can lead you to assume there is not any relationship and thus discard and ignore a very valid but non-linear relationship. This is a serious problem.
As with “significance”, using the same word for a mathematical term that we use in everyday language can lead to serious mistakes. Once explained in this way, it may seem obvious but starting an analysis by filtering early, only looking for relationships with high correlations, remains shockingly common even with people that are aware of the problem.
B). There can be a logical relationship which is important
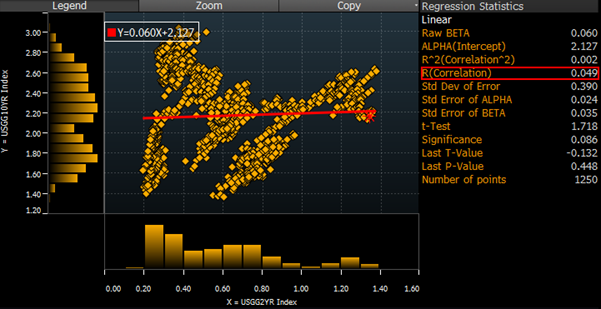
Take an example from financial markets, there is an intuitive connection between the short end and the long end of the bond market. If we look at US government bond yields 2 year (x-axis) versus 10 year (y-axis) over the last 5 years (chart below). The correlation between their levels is virtually zero and, if we were to only look at correlation, we may falsely conclude there is no relation between them.
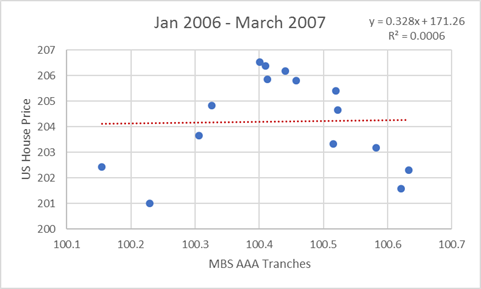
A more dramatic example with very dangerous consequences was the lack of a correlation between US house prices and the price of AAA tranches of mortgage backed securities before the crisis.
Before the crisis Correlation coefficient virtually zero
During the crisis Correlation coefficient = 0.96 (virtually 1!)
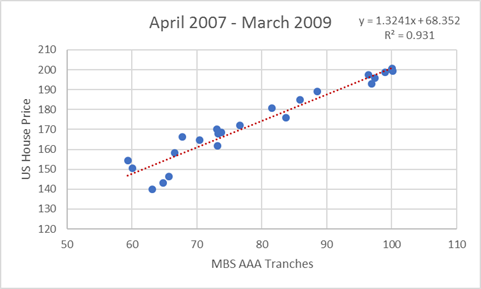
This was a very bad way to think about the relationship but a huge amount of money was invested on this poor assumption. It also relates to a serious logic flaw – just because something hasn’t happened in the past does not mean it can’t happen in the future.
- Correlation does not imply causation
Everyone is taught this early in the study of statistics. Often with an example, as below, of a spuriously high correlation, where the intuitive relationship suggests something rather different.
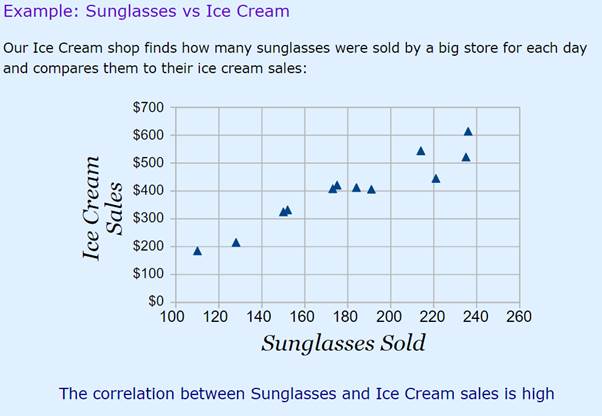
https://www.mathsisfun.com/data/correlation.html
Everyone knows that ice cream and sunglasses have a common driver i.e. the weather. Perhaps it is less well known, how frequently this error is repeatedly made in economics and finance, even in the upper echelons of academia and policy making,
The policy impact and subsequent furore over the paper “Growth in a Time of Debt” by Carmen Reinhart and Ken Rogoff is a notable example. They found a correlation between national debt and growth rates, stating that “for levels of external debt in excess of 90%” GDP, growth was “roughly cut in half”.
On both sides of the political spectrum, the calculated correlation had become all that mattered:
- For those who wanted to reduce budget deficits in the US and UK, this was referred to as “conclusive empirical evidence” (Paul Ryan) and “convincing” (George Osborne). A strong correlation proved the case for austerity
- For their opponents, their attention was focused on the details of a data error which reduced the strength of the calculated relationship. The weak correlation proved there should be no restriction on debt levels.
Both sides of that argument were so simplistic, it was bizarre. This is not a fault of the original work, doing statistical analysis is a good idea, it is a fault of over-simplistic interpretations of its meaning.
The relationship between macro data and financial crises are similarly an area of extreme concern.
It may be true that there is a correlation between budget deficits and currency crises.
If you then conclude that budget deficits cause currency crises, then it is a quick jump to proposing that the way to prevent a currency crisis is to focus on the deficit and cut spending.
This of course fails to explore some crucial, causal links. If budget problems and currency weakness are both manifestations of a common underlying problem then treating one of the symptoms will not cure anything. Once again, an overly simplistic analysis based on correlations can lead to disastrous policy recommendations.

One thought on “The Misuse of Correlation Part 3”