A historical context for the 2020 recession


To understand where we are in the current economic downturn, it is helpful to look at previous times of recession and economic upheaval, comparing if it looks fast or slow compared to them.

Early 90s

This was a short and mild recession. The total drop in output was around 1.4% and the recovery to the previous GDP level took 2 years, growth then resumed at the same rate as before the recession. I estimate a permanent loss in output of around 6% of GDP.


Early 2000s

From memory this felt like a major recession but looking at the data it was very mild. Growth averaged around zero for 2 years, before starting on the previous growth path. Again, I estimate a permanent loss of GDP of around 6%.

Great Recession

Here the recession was much deeper and longer. A total drop in output of 4% and it took 4 years to recover to the previous level of GDP. I estimate the permanent GDP loss compared to the previous growth path to be 10%.

What can we learn from previous recessions?

  1. Future growth path

I cannot find an example of where we returned to the previous path of GDP. The loss of GDP is permanent but on the positive side in every case, we returned to the previous trend growth rate.

  1. Timing

The more severe the recession the longer the time to recovery and the greater the permanent loss in GDP. In the early 90s and early 2000s, it took about 2 years. For the Great Recession the loss of GDP was about twice as large, and it took about twice as long to recover with 4 years before the US regained its previous level of GDP.


How does the 2020 recession compare?

Q1 GDP came in at -4.8% which already puts this recession as larger than the ones we saw in the early 90s and 00s, second only to the Great Recession of 2008. However lockdowns only really came into effect during March, the last month of Q1.


How about Q2?

This is where the numbers look extraordinary and charts will have to change their scale dramatically. As I described in the previous post, recent estimates are down 35%.

https://www.frbatlanta.org/-/media/documents/cqer/researchcq/gdpnow/RealGDPTrackingSlides.pdf


Has there ever been as large a recession as this one?

The only comparison that can be made is with the Great Depression when GDP dropped a total of 25% between 1929 and 1933. In this case it took over a decade to sustainably exceed the 1929 level of GDP.

What does this tell us about 2020?

History tells us that the more severe the recession the longer it takes to recover. This recession is far more severe than any on modern history.

Many economic forecasts and especially the stock market tell us it will not follow the path of previous recessions and we will rapidly return to previous levels of GDP. I do expect a large retracement of the negative drop in the first half of this year. But I cannot see us getting close to previous levels of GDP any time soon.

In my next post I will examine the particular nature of this recession and how it may develop.

What are economists predicting for the US economy?

In the chart below, I have taken a consensus forecast for US GDP growth over 2020-2021, averaged across a range of banks and economists. There is a sharp fall from the initial impact of COVID and the lockdown, followed by a rapid bounce from Q3 onwards. We see a return to pre COVID levels of GDP by the end of 2021.

(Note US GDP estimates are quarter on quarter, unlike the UK which is quoted year on year.
For Q2 US GDP the shocking estimate of -34.2% has to be divided by 4 to produce the annualised number that I show here as an index.)

I started my career producing economic forecasts and through this learned what they can and cannot be reliably used for. The basis of economic forecasting comes from taking historical economic data and building relationships to project into the future. When we are facing a situation we have never seen before, this approach has many issues.

It may seem silly but a lot of important “results” from forecasts are merely derived from underlying assumptions. The first assumption here is that economic activity will return to its former level, and next is how long it will take. Once you have decided these, you just need to draw a smooth line between where we are now and that future point.

From the data above, economists are predicting that we return to previous levels of economic activity around the end of next year. It needs to be understood this is a guess and an input to the model, not an output.

How can we show this effect?

To show how this works, we have had a good deal of economic data from the past few weeks which has been far worse than economists predicted. This has led them to sharply revise lower their estimates for Q2 GDP.

As Q2 estimates are revised down, and given the underlying assumption that we will return to previous growth levels, all that happens is that the “V-shaped” recovery is even more sharply V-like. In the chart below, we can see how the forecasts changed between April and May, the Q2 forecast is clearly much lower. As time goes on the “forecast” for Q2 is based increasingly on data we have actually seen. Q3 is then revised higher given the underlying assumption but impervious to incoming data. This logic is that if lockdown is more severe than we thought, then removing lockdown must be much better.

In the Great Recession, the forecast evolved in a similar way with an ongoing assumption of a sharp rebound. When the sharp rebound failed to appear, the estimates delayed it by a quarter, and then another quarter etc.

Eventually, if the bounce is long enough delayed, then economists start to predict that it will never come. In early 2002 forecasters were optimistic of a rapid bounce, but in reality there was a second dip and credit crisis. By spring 2003 many economists were forecasting an “L-shaped” recovery, a prolonged Japanese style lost decade, just as the bounce actually began. I do not mean to disparage economists, after all I was once one of them, but just to recognise that this is something that we do not understand well and we should not place too much faith in forecasts of this type.

To be fair, the current batch of economic forecasts come with a warning that risks are skewed to the downside. For example, they are assuming no second wave of infection, no second lockdown, and no lasting impact on human economic behaviour. In the case these assumptions are incorrect, a second forecast may be provided which can later be pointed to, claiming correctness after all. These other forecasts are essentially the same as the first one, except that the bottom of the V is lower and a little later and the rebound is even sharper so that we return to previous levels of GDP just a little later than in the base case.

Economists produce forecasts like this for a reason. What people want from forecasters are absolute point estimates. People have simple questions such as “when will the economy be back to normal?” but sometimes economics is not well suited to doing this and the only way to produce a forecast like this is to guess. The issue does not solely lie with economics, it lies with what we expect it to be able to do.


Is there no other way to make a forecast?

What I will do in my next post is some attempt to dive into what generally happens in a recession and put the current recession into a historical context for comparison. From this, we can examine the potential paths forward while avoiding overly precise point estimates of future GDP.

Equity Valuation – Part 1 Without COVID-19

To understand the current equity market valuation, a good place to start is to do a quick analysis of what market value looked like at the start of the year. We can then look to separate the impact of COVID on the economy and markets. At the time of writing, the S&P is heading towards 3,000.

PE ratio

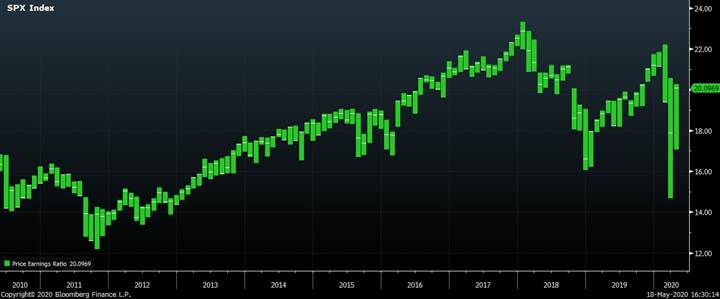
A simple and decent method of equity valuation is to look at the PE ratio overtime – price of equities divided by their annual Earnings. For the S&P, it is currently just over 20, which is roughly the middle of the range of the past 5 years. Furthermore, it looks even more reasonable when compared with fixed income where bond yields are close to nothing.

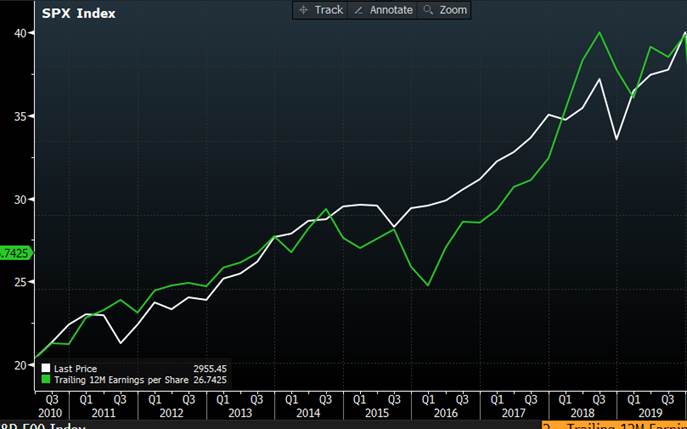
Over the same period the stock market has risen strongly. In the chart below, I show that the value of the S&P has doubled in the last decade, as have quarterly earnings (S&P EPS)

Where does earnings growth come from?

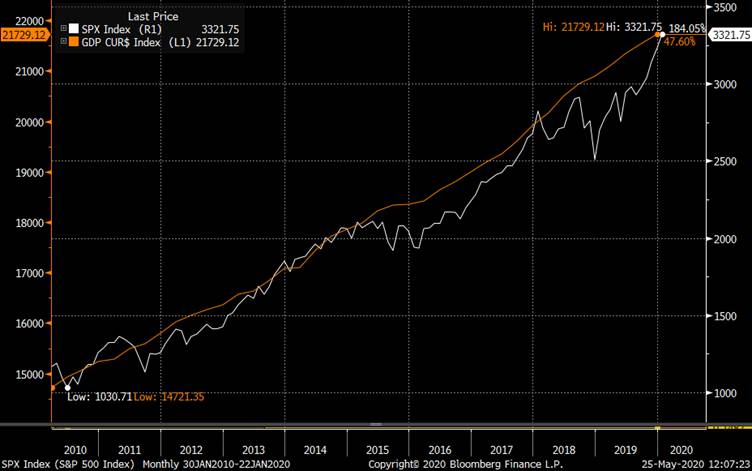
The answer is of course that companies are part of the economy and as the economy grows then corporate earnings also grow. In the chart below, we see uninterrupted US GDP growth for the past 10 years and also a rising S&P based upon growing earnings.

This must all be consistent then?

This simple look at equities implies that the rapid rise in equities over the past decade has been fully justified by the fundamentals in the economy.

But I played a little trick in the charts above.
While the stock market, GDP and corporate earnings have all gone up over the past 10 years they have not gone up by the same amount.

  • Nominal GDP has risen by 50%
  • Corporate earnings have doubled
  • The US stock market has tripled

The part I want to look at more closely is the difference between GDP growth and the far more rapid growth in corporate earnings.


Any Reasons to be cautious?

It is remarkable to have such a large rise in earnings when compared to the overall economy and one would expect to see profits as a share of GDP to have risen significantly over the same period. With decent overall growth, then you might expect growth in profits to be better, and to offset this the share of the economy going to workers would be reduced. This would fit the idea that while growth has been good, more of the benefits go to the capital and capital owners and less to workers; in this recovery a lack of real wage growth is often cited as a concern in the face of rising equity prices.

When I look at the data however, it does not fit this intuition. This is a chart of corporate profits as a share of GDP over the past 60 years.

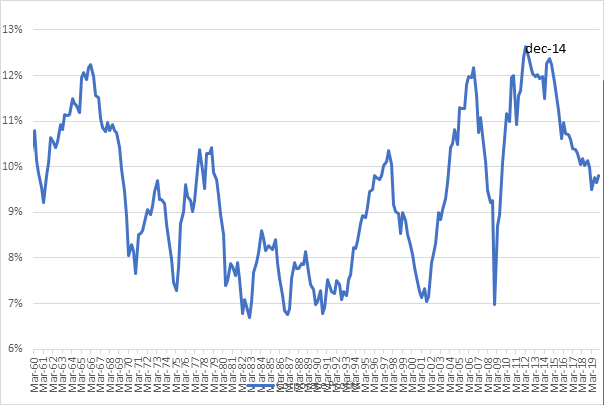
We can see it strongly mean-reverting and so the recent pattern is exactly what we would expect to see. In a recession wages are sticky and do not readily fall; it is companies that have profitability issues. We all know that companies go bust in recessions and in 2001 profits fell to 7% of GDP. In the early stages of a recovery, it is profits which rebound the fastest, wages remain subdued as there is still high unemployment so the gains from GDP growth go to businesses, and by 2014 profits as a share of GDP had nearly doubled to 12%. But later in the cycle this reverses, and profit margins are squeezed, which they have been for the past 5 years.

This does not make sense!

I have just told you two contradictory stories. One is that corporate earnings have been rising rapidly over the past few years, far faster than GDP growth. The other is that profits as a share of GDP have been falling as we would expect late in the economic cycle.

The reason I can tell you two completely different stories is that I have two different data sources. The first is the earnings (S&P EPS) as they are reported by companies. The second is profits as they are recorded in the income method GDP data – known as the NIPA data (National Income and Product Accounts).

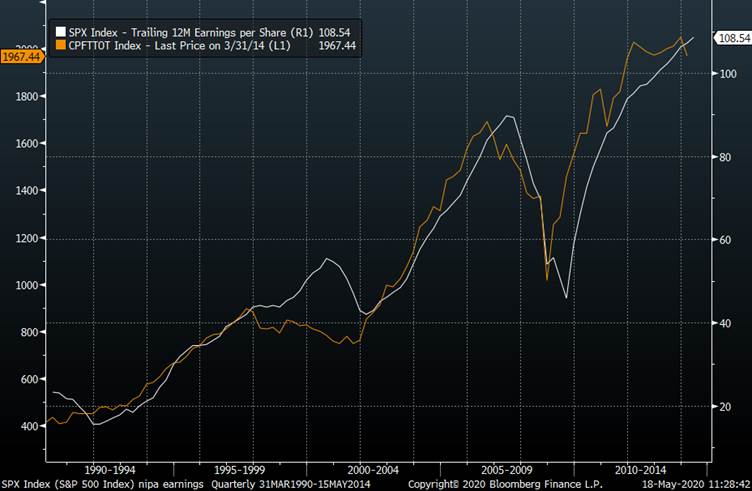
These two ways of measuring earnings are not exactly the same. For example, the S+P is only 500 companies whereas NIPA represents the entire US corporate sector. There are also differences in accounting and tax. But logically they are highly similar, and it is no surprise that historically they track very well. Here is a chart from the late 80s until 2014 showing the rise in earnings (EPS) as measured by companies and as measured by the National Accounts. We can see that in the long run, they track pretty well but there are some periods of divergence for instance around the time of the dot com boom in the late 90s.

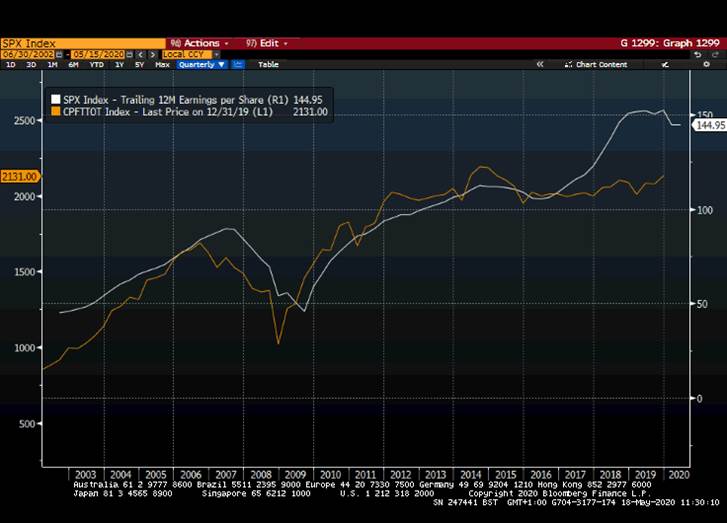
If I draw the more recent history, we can again see this divergence. The reported earnings have been rising rapidly (white line) while the NIPA measure of profits has been stagnating (orange line).

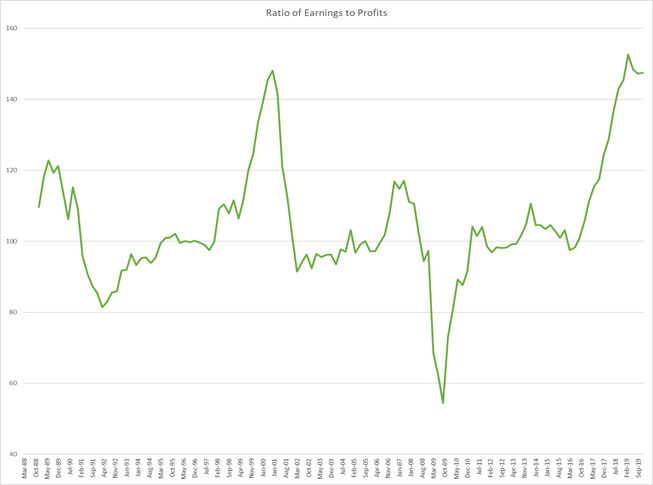
The relationship is easier to see if we take them as a ratio. In the chart below we see a large spike around the Dot Com bubble (EPS growing more than NIPA), a large spike down during the Great Recession (the opposite) and another large spike higher recently.

These differences are so large that they require an explanation.

  1. Dot Com spike

A bubble emerged in the late 90s with very high PE ratios i.e. companies were expensive compared to earnings. In addition, these reported earnings were inflated; a famous example you may recall was Enron who were highly “creative” with how they recorded and reported their earnings. When the bubble bursts and we move into recession then these accounting methods are not sustainable, and we see the rapid fall in reported earnings and the ratio of reported earnings to NIPA data renormalizes.

There is a danger in that earnings are presented to us by corporates in the most flattering version they can create. In a bull market, there are opportunities to keep presenting this managed version, perhaps similar to how people curate their Instagram feed. Through heavy use of filters and selective framing, someone might look as though they are very attractive with an opulent lifestyle. The recession is the equivalent of when you meet them in person and realise that the reality is not exactly what was promised.

  1. Great Recession

This rapid fall in reported earnings is easily explained as a result of huge write-downs taken by financial firms. This is a good example of an item that is recorded by companies as a change in earning, but not included in GDP data. Once the write-downs have finished, the ratio between reported earnings and NIPA profits renormalizes.

  1. Now

I have been searching for a good explanation of this divergence and am yet to find one. One plausible idea is stock buybacks, but this is not true as they are adjusted for in the earnings data. Other sources of divergence such as tax are real but do not come close to explaining the large difference.

Could the NIPA data be wrong?
This is data that will get revised, but it would take something extraordinary for GDP revisions to change corporate profits by the 40% divergence we have seen to EPS

Could it be financial accounting manipulation?
Some argue the rules are so much stricter now, so it is not possible. Surely what we learned from the last crisis is that Rating Agencies having strict rules on how to make a security AAA that enabled smart bankers to arbitrage those rules. I do not believe we could ever have rules so strict that smart bankers cannot find ways to optimise them. This does not mean that people must be lying or breaking the law. Bear in mind virtually everything that Enron did to inflate their earnings was legal.

Could it be offshoring profits?
There could be something here and it is a very murky and complex area. We know that the large tech companies have found ways to limit their onshore earnings, keeping profits in countries where they have to pay no tax but this is hardly a new phenomenon. It is something I will be looking into as an explanation.

Could it just not be a problem?
Maybe this is the first time we have ever seen a large, rapid, permanent shift in the relationship between reported earnings and NIPA data. Maybe. Most people in effect seem to be assuming this and financial markets are not at all concerned.

What if the NIPA data is right?

If the NIPA data is correct, then the PE ratio is currently far higher than 20. In the previous two cycles it was reported earnings that correct, not the NIPA data, and the timing of the correction is during a recession. As Warren Buffet said “You only find out who is swimming naked when the tide goes out”.

Summary

My view of value before COVID was that it was reasonable to belong to equity markets early in 2020. I was aware of the NIPA data divergence as an issue, but it has been an issue for a long time and it has not been a market driver. The trend towards higher earnings and higher equity prices had been very strong and I believed that it would take an event or catalyst to reverse it. If we are heading into a significant recession, then this may be the time we understand if the relationship between reported earnings and GDP profits will reconnect.

3 paths forward for the economy

The pandemic is affecting the entire world, but we are seeing very different approaches to dealing with it in different countries. I have identified 3 broad strategies each of which will have very different outcomes in terms of the economic outlook. In this post I am not looking to evaluate the approaches from an ethical or public health perspective, but purely on what the likely economic results will be.

Path 1 – Control the Virus e.g. New Zealand

This is the approach I have been advocating and which I spoke about on my recent IAN talk. Please click below if you are interested in watching.

https://us02web.zoom.us/rec/play/vcUpIuyqq243GdPA4QSDB_NwW460f_2s2yJN_adfzh7kBiECN1ahb7QRYObZgJqcT5PkXmHALrgTT-6W?autoplay=true&startTime=1589914624000

This approach has been very successful at controlling the virus in some countries such as New Zealand, Norway, Singapore, China and Australia. All of these countries now have low levels of infection and can look at a material reopening of their economies. Other countries have been trying to play catch up, are past the peak in their infections and are maintaining lockdowns until the level of infections comes to a low level. This group of countries includes Canada and most of the EU.

This has not been an easy path to follow and for it to be successful it does not only take the good public policy but also it critically requires huge public support for measures which involve massive changes in behaviour. The countries that have been successful have given clear and detailed public health messages which have been adhered to due to high levels of public support and trust in the country’s government and institutions.

The economic impact of COVID has been very severe but these countries are the most likely to hope to experience COVID as being economically similar to a natural disaster and see a sharp rebound in economic activity. Bernanke, ex-Chairman of the Federal Reserve in the US, likened COVID to a snowstorm. In a snowstorm, we halt much of the economic activity but once the snow melts, we can go back to how we were before.

Waiting until the level of infection is very low has two big economic benefits

  1. The number of people infected is low, which means that anyone you interact with is highly unlikely to have the virus and so all the allowed activities are in effect very safe. This means people are confident to go back to work and do the allowed activities as you reopen.
  2. There is room to experiment with the reopening and how it impacts R0. If the impact is larger than you expected for an activity, then you have time to reverse the policy as the absolute number of infections remains very low. There is no danger of the virus getting out of control quickly.

With COVID the world will not be the same as before, but it may be possible to reopen large parts of the economy while keeping the rate of transmission and level of infections low.

Path 2 – Herd Immunity e.g. Sweden

I have used Sweden as my example but at the moment, to be honest, it is my only one and is a global outlier. It is the only country I know which has chosen to follow this path with high public approval and consent which makes all the difference to the potential economic outcome.

The choice to manage the spread of the virus with the longer-term goal of herd immunity is clearly possible. The economy is not shocked by the strict lockdowns and only a milder form of restriction is made to slow rather than to reduce the virus. Sweden has high levels of public support with 70% of the population supporting its government’s approach. With public trust and support the economy continues to function with a far milder slowdown in economic activity.

The data from the antibodies tests in Stockholm last week were broadly in line with my expectations but completely shocking to the Swedish authorities. With only 7.3% of Stockholm residents testing positive for the antibodies we can imply a mortality rate of 1.5-2.0%. This is slightly higher than the results from New York, France, Spain and the UK which all suggested 1.0-1.5% but I would suggest is within a margin of error given the relatively small sample size.

From outside Sweden we might think that this result would lead to a change in policy and a dramatic fall in public support but so far this does not seem to be the case at all. This implies that Sweden is uniquely happy to follow this route and I cannot say that the economic outcome should be poor. Whether it is better or worse economically than the path chosen by other countries such as Norway is not clear yet, but I see no reason to think it materially better or worse.

While I said that Sweden is my only example of herd immunity with broad public support it is not my only example of a country pursuing this strategy. A good example is Brazil where the government under Bolsonaro has deemed COVID to be “a little flu” and will not pursue any public health measures. But the population is not supportive of this plan which will lead to severe economic disruption. Without consent the population is afraid and so its behaviours change, both on the supply side as people do not want to go to dangerous workplaces, and on the demand side as a lack of confidence leads to a decline in spending and investment.

It is important to note that from a public health perspective Path 2 is the default strategy. Anything less than a strongly concerted effort to control the virus will make it continue to spread and grow. But going down this path with consent like Sweden has a very different economic outcome to doing it without consent.

Path 3 – Neither of the above e.g. UK, US

This occurs when there is a major divide between those who want to follow the two paths above. A majority of the population would prefer to take Path 1 and control the virus but a significant minority, including the government, prefer Path 2 to reopen the economy even if the virus is not controlled. This is the situation in the US and increasingly clearly also in the UK.

For both the US and the UK we went into lockdown late, made the lockdown not very strict and are moving to ease restrictions before the level of infection is low and declining. There has been some attempt to control the virus, but it has been half-hearted and thus ineffective.

Trump gets pretty uniformly panned in the UK for his approach but in a way, it has a certain brutal honesty to it. He does not really pretend that he cares about public health, he is very clear that he cares about the economy. He does not argue that it is safe to reopen, he argues that the economy comes first. The US public has a majority in favour of controlling the virus but has a significant minority that strongly prefers Path 2. Those people are also Trump’s support base and so politically it should not be surprising that he is pursuing a policy path which they support even if a majority of the broader country do not. Trump has never really been a President who wanted to govern for everyone, he governs for his base and his interests. It remains to be seen if he can generate widespread support for his approach.

The UK political landscape is somewhat different. We have a clear majority in favour of following Path 1 but again a significant minority who prefer Path 2. Looking at the opinion polls I do not see the strong divide in the country we had with Brexit. 73% of the UK population wants clear advice with detailed guidance, not the muddling appeal to “common sense” that we are getting. It is true that Conservative voters, Leave voters and older people are more likely to want to reopen earlier but there is a majority in all categories for a focus on public health and caution on reopening. But importantly the relatively small minority who are very keen on a rapid reopening are the small subset who are the type of people who are members of the Conservative Party and also the type of people who are Conservative MPs and in government.

https://docs.cdn.yougov.com/oygox62yaw/YouGov%20Covid%20Lockdown%20Results%20May%202020.pdf

I am sure there are many in the UK government who passionately want to follow Path 1, perhaps after his ICU experience that even includes Boris Johnson. But we also have Dominic Cummings who showed what he thought of the “Stay at Home” slogan by travelling 250 miles to Durham, and Rishi Sunak who is arguing for a swift reopening.

The effect of a split in government and a lack of clear direction is that the default strategy of letting the virus run away again becomes the effective policy. This is in effect the same policy that Trump has adopted but confusingly the rhetoric is entirely the opposite. When Trump argues for reopening, he talks about individual liberty and the economy. When the UK government argues for school reopening it does not say what everyone knows i.e. it is an economic priority. Instead, Gove tells us it is “safe”, and Williamson uses emotional blackmail on teachers to tell them their pupils need them. This contradiction between rhetoric and reality leads to further erosion of public trust.

To follow Path 1 the government needed to build a consensus in early March for measures which the public initially did not think we needed. It could still attempt to use the majority support for prioritising public health now to try again to make more effective policy. Instead, it is using the rhetoric of public health to sell the policies of reopening. Even now the slogan is

“Stay Alert – Control the Virus – Save Lives”

This is a slogan for Path 1. But all the policies are moving towards Path 2. I do not think this has a good outcome. The result will not be the economic recovery they hope for as without trust and security our confidence is so impaired that no recovery is possible.

If we combine the rhetoric of a government focused on controlling the virus, with the actions of a government that will not do so, I expect to see both a rising infection rate and also a misfiring economy. In this case, perhaps the government will admit its mistakes and refocus on being effective in controlling COVID. Or perhaps they will claim they have done everything they can, that controlling the virus was not possible as people did not “Stay Alert”, and we should move down Path 2.

Which of those sounds more in character for this government?