Relevance to the present
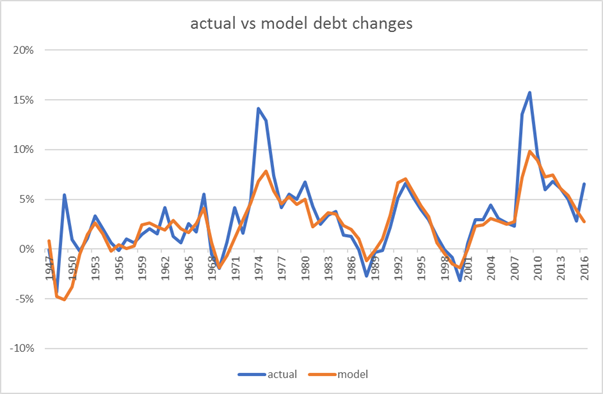
Previously, we looked at the UK government debt in the post WW2 period.
Two clear questions arise –
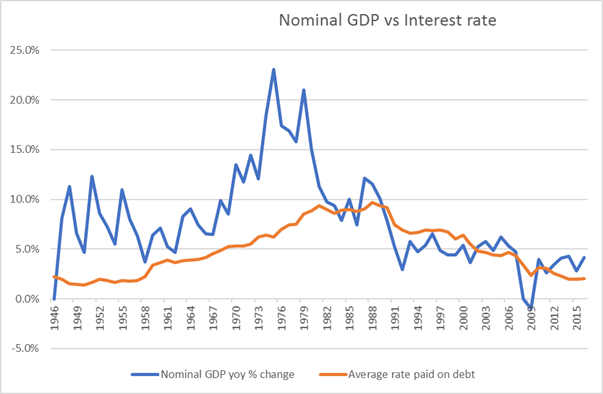
“How did the UK manage to keep its rates so far below nominal GDP?”
“Should we expect to be able to do the same in the future? “
The key to inflating away national debt is the ability to force domestic investors to hold government debt at well below the yield they would get in a free price-setting environment.
Sometimes this is reported as financial repression.
Again, this paper does a really good job of giving the details of the post WW2 period. https://www.imf.org/external/np/seminars/eng/2011/res2/pdf/crbs.pdf
Comparison post WW2 period to Current
I am interested in the extent to which the situation could be the same for other countries today.
My bias is that it would be significantly more difficult and we should not assume that because it worked in the 1950s it will work today.
- Ability to force domestics to hold govt debt
This is probably the easiest and we are seeing plenty of this at the moment.
e.g. pension funds and banks being required to hold government debt for “liquidity” or “prudence”
But the danger of the current system is leakages
- Capital controls
Post war Bretton Woods we had globally imposed coordinated capital controls that reinforced home bias. In effect, countries agreed not to compete for capital through the price mechanism. I see this as a form of cartel which managed to hold together until the 1970s. We are a long way from that kind of cooperation today.
- Ownership of debt
It is much easier to coerce domestic investors than foreign ones. In many heavily indebted countries, the issue is that debt markets are owned by foreign investors. This was a big factor in the Asian crisis of 1997/8 and the Mexico crisis of 1994. Currently, the Gilt market is 25% owned by overseas investors which makes it perhaps a little vulnerable. In contrast Japan has a higher debt level but virtually all the debt is owned by domestics.
- Trade surplus/deficit
Post WW2, the UK was close to balance and now has a large deficit (over 4%). This deficit needs external funding which currently comes from FDI. All this adds extra pressure and vulnerability to the situation.
- Sensitivity of average rate on the of debt
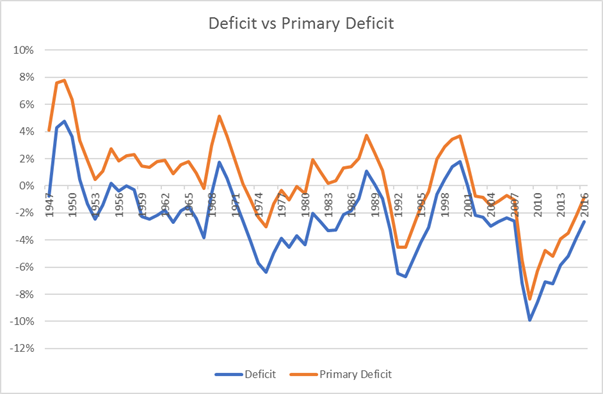
In ideal world, the debt market would be structured as conventional Gilts with as long tenor as possible whilst running a primary surplus to offset the interest payments. Even if short rates and inflation rose, the rate paid on the debt would stay the same thus somewhat mitigating rollover risk or the risk of paying much higher rates overall. Unfortunately, this is not the case in most developed countries as QE has been making situation worse.
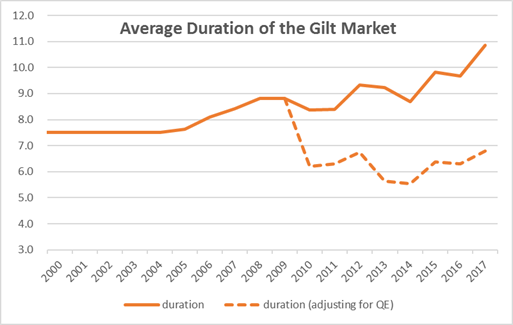
QE shortens duration of the debt market
One way to think of QE is as a shortening of the duration of debt issuance (another post I think) then the impact on the debt profile is to significantly shorten it. In this light, QE on the Bank of England’s balance sheet simply means that rather than having a £435bn liability of long duration it is paying overnight rates on bank reserves. When (/if?) the Bank raise rates then they are immediately paying higher rates on the debt. (note debt and liability mean the same thing here).
Below is a chart of the average duration of the Gilt Market since 2000
Final Thoughts
I have frequently read the argument that we can inflate our way out of our current debt problems by having faster growth and inflation. The obvious flaw in this argument is it requires independence of nominal GDP growth and interest (i.e. Central Banks would not raise rates in the face of higher nominal growth which is clearly not the case). In the modern market economy, nominal growth and interest rates are highly related and so just assuming they are not is both bizarre and surprisingly common. Alternatively, you can concede that there is a link between growth and interest rates but remain very confident in the ability of modern nation states to impose financial repression with no leakages.
From my understanding of the modern financial system, I do not share that confidence that current debt levels can be easily reduced and therefore, I do not think they can be raised with impunity. It does not however follow that I become an austerity-hungry debt and deficit hawk.
This debate that I read between economists and political commentators appears depressingly partisan with far more noise and anger than analysis. What really matters is whether the current situation is risky enough to merit policy action or, as investors, some active asset re-allocation. This is highly complex but in my view, economic analysis is falling short in its ability to help. If your answer to the question of whether government deficits should be higher or lower is the same at all times, across all countries, then I would suspect that your economic model is not going to be very helpful in making policy or investment choices.