Trussonomics

I am confused by the calm coverage of the recent radical shift in economic policy – described by the BBC as “bid to boost growth”.  This type of reporting does not make clear whether we are talking short-term growth or long-term potential, and how these policies impact each of them in very different ways.  From conversations with friends, much of the analysis does not investigate this and ultimately reveal just how dangerous and radical this new set of policies is. 


Potential Output – what is it?

Truss has justified her policy changes economically citing improvements in the UK’s long-term growth potential i.e. increasing potential output

Potential output is the starting point for thinking about how much the country can produce ie it is the maximum sustainable level of output. 

If we are below, then this is called a negative output gap and we see things like unemployment rates being high and inflation likely falling. 

The OBR does a great job on this and their website is very clear

Potential Output – how can we improve it?

Everyone wants to improve potential output and there is a clear left vs right divide on how best to achieve it.

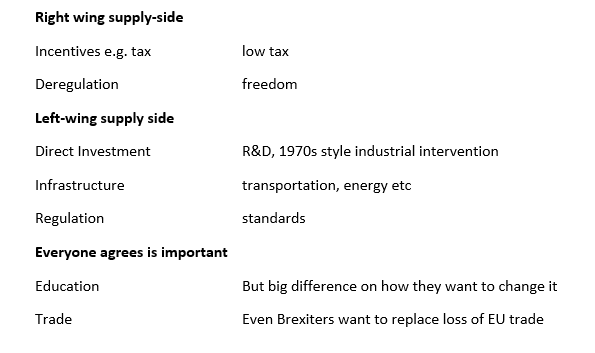
Truss is firmly in the right-wing supply-side movement of “trickle-down” i.e. give tax breaks to rich people and everyone will be better off because somehow this leads to greater potential output.  Reagan was the most prominent exponent of this view but we are still waiting for any evidence that it works.

Potential Output – will it work?

I think best to simply summarise that there is no evidence that cutting taxes has any positive effect on potential output.

OK – so if Trussonomics does not improve potential output, what does it do?

It does a LOT

The most obvious and direct impact is of course on inequality.  She is delivering a massive cash handout to rich people.  The richer you are the more you get. 

The part that is getting less attention is the impact on

  1. Fiscal vs interest rate policy mix
  2. Debt sustainability
  1. Fiscal vs interest rate policy mix

This policy choice has been perhaps at the heart of the political battle of the past decades and is commonly misunderstood.  This is a shame as a simple quadrant model does a good job of providing a framework to compare the options clearly. (Fiscal policy is the mix of tax and spending with high spending/low tax being loose fiscal policy)

Tight fiscal -tight monetary         When you are committed to fighting inflation above other policy goals.  For example, the 1980s or commonly after an economic crisis when trying to rebuild confidence in the currency and debt.  If used inappropriately looking at the 1930s Great Depression.

Tight fiscal – loose monetary     This is the Cameron years.  There is of course a debate over how tight fiscal policy should have been and on how the mix of tax and spending was managed.  But it is a consistent policy mix

Loose fiscal – loose monetary    This was at its maximum during the pandemic i.e. for a short term huge negative shock.  If used long term it just leads to economic catastrophe.

Where are we now?

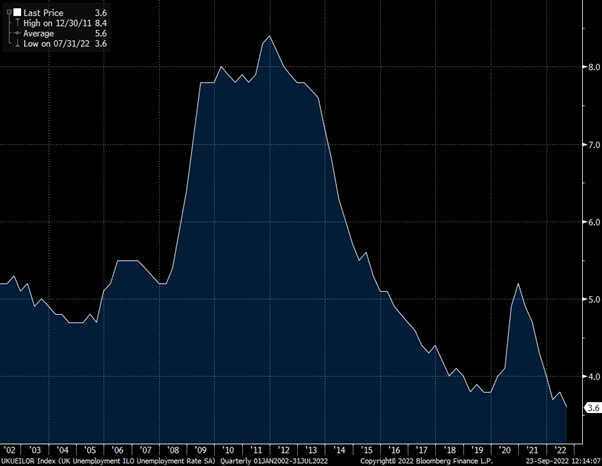
We are currently in the loose/loose box.  Taking the unemployment rate as a simple measure of the output gap, you can see from the chart below we are at record lows.  This is also clear to anyone trying to hire at the moment and all the reports of staff shortages.  Which makes it odd that Truss talks about “boosting growth” as there is no prospect of lower unemployment from here.

UK Unemployment at record lows

The other factor that makes going for growth an odd policy goal is that inflation is high and rising.  This does not have an easy solution and economic pain is unavoidable.  Trying to avoid it, leads to even greater pain later.

UK Inflation at 30-year highs

What happens next?

The Bank of England will be forced to raise interest rates by huge amounts.  At the start of this year the market expected interest rates to stay at around 1% though 2022 and 2023.  Now the market expects rates to be 4% by the end of this year and 5.5% by the end of next year- with rate expectations for next year shifting 3% since the start of August. 

What does this mean for people?

Well rich people have had a large tax cut and will be fine – I know you are all relieved to hear this.

Anyone on a regular income has had a small tax cut but this will be dwarfed by the rise in the mortgage payments coming soon.


What does it mean for the economy?

I predict a very bumpy path and hard landing for the economy but difficult to say when.  The policy mix of vast fiscal expansion at a time of low unemployment and high inflation to be offset by rapid interest rate rises is a chaotic mix.  I think the economy will stay strong and then crash hard. 

  1. Debt sustainability

This is getting some attention but is being dismissed by Truss.  The fact that they did not let the OBR produce a forecast tells us a lot about how they have contempt for this constraint on policy.  An Office of Budget Responsibility is not what the Chancellor wants to hear from!

But the bond market still exists, and long-term government borrowing is getting hammered.  30-year Gilt yields have risen from under 1% at the start of the year to 4% as I write this.

The tax cuts and extra spending increases the budget deficit.  The rise in interest rates increased the cost of servicing the debt, further increasing the budget deficit.  This can become an exponentially explosive mix with the major accelerator being a currency crisis as the value of sterling falls.

Conclusion

The Trussonomics experiment is radical and dangerous.  I expect high inflation, high interest rates and a weak currency leading to economic crisis.  Politically I expect her to start to blame the Bank of England as though the rise in interest rates was not a direct result of her policies.  The Bank of England may be independent of the government, but they are not independent of economic reality.

Truss has spoken of her disdain for “abacus economics” and she does not believe things need to add up.  I think economic reality exists and her magical money tree fantasy will fail. 

Has the US stock market disconnected from the real economy? Part 4

In my previous three posts, I examined the pricing fundamentals of the US stock market. In this post I will look at possible explanations for the pricing.

  1. Don’t fight the Fed

The argument here is that the Fed is active in monetary policy to offset the negative effects of the recession. In the recessions of 2001 and 2008, interest rates were around 6% and could be slashed giving a huge boost to the economy. In addition, in 2008, the Fed began its expansion of its balance sheet and continued it with QE in 2010.

In the recession of 2020, the Fed’s tools are more limited but it is fair to say they are using them as aggressively as they can and have managed to get long term interest rates to fall despite the vast surge in government debt issuance. The question remains of why the Fed will be so much more effective now than in previous recessions as the forecasts and pricing suggest.

The argument that yields have fallen and so the yield on all assets should follow is decent and intuitive but doesn’t explain why pricing is so much more optimistic than in previous recessions. In the other recessions of 2001 and 2008, we also saw sharp falls in interest rates but the impact of the drop in growth and thus earnings vastly overwhelmed this. The argument to justify the current situation would have to be rather different, that earnings will not drop very much (unlike previous recessions) and that Fed intervention will be huge and long-lasting, despite a rapid recovery of the economy.

It is true that Fed intervention this time around is truly monumental, the increase in the size of their balance sheet is over $3trn in the past quarter alone. If you can remember as far back as the Global Financial Crisis, the increase of $1trn in the balance sheet was seen by many as dangerous and would inevitably lead to hyperinflation. It may indeed be true that this huge intervention has flowed through to other asset markets, driving this stock market rally, but I do not expect the rise to be permanent. I do not expect the Fed to keep buying $3trn a quarter in financial assets to support the markets, particularly if the analysts are correct in expecting profits to immediately bounce back.

  1. Private investors

This is an argument I find rather appealing. Fiscal transfers from the US government, in response to Covid, have been massive but poorly targeted. For example, the PPP (Payroll Protection Programme) came in the form of forgivable loans which did not have to be fully spent on payroll. Much of $500bn PPP has been in effect gifts to affluent people who do not need it to support spending.

Overall transfers from the government have been over $1trn, whilst spending has fallen by nearly $400bn. This leaves a lot of extra cash sitting in the bank accounts of affluent people and since they are not spending it, they are investing it. I would suggest in equities and putting that much money into the US market in a short time is going to have a large impact on the price.

Looking more closely at the typical small investor in the US, there has been a recent move to choosing their own stocks. They will tend to pick stocks they have heard of, that has been rising rapidly, that is sexy. They buy tech stocks like Amazon, Apple, Google, and Facebook. They even buy Tesla because Elon Musk is so often in the headlines and he makes it sound like a tech stock.

This is a classic bubble environment. A rapid influx of new money causes a spike in prices, whether it is art, vintage cars, fine wines, or stock markets. Tesla is now worth more than all the other car manufacturers in the world combined while producing less than 1% of the cars. It takes a lot of effort to find a fundamental rationale for that.

Has the US stock market disconnected from the real economy? Part 3

In the last two posts, I examined the fundamental basis for earnings of the US stock market. In this post, I will look at pricing and to what extent the market is discounting any of the risks highlighted.

Given that we have been looking at earnings already, all we need to get to the index price is to multiply by the Price-Earnings (PE) ratio from the chart below.

It is clear from the chart that PE ratios have been rising as confidence in the durability of profit growth has cemented. The current pricing levels are such, that even if earnings do return to record levels in late 2021, we would still have a PE ratio at the highs of the last decade.

This suggests that far from pricing any risk that NIPA data might be correct, or that the earnings drop might resemble previous recessions, the market is currently fully pricing a return to record profitability and excellent growth in profitability to continue from there.

I would rate stock market optimism as extremely high.

Has the US stock market disconnected from the real economy? Part 2

In the previous post, I examined the relationship between the economy and corporate earnings and showed that we should be sceptical about the numbers reported by companies as “earnings”. Profits, as measured by the national accounts data, not only suggest profits might be 30% lower than companies represent them to be but that they have also been declining for the past few years, rather than ever rising to record highs in the earnings series.

In this post, I will leave aside scepticism on historic reported earnings, and instead examine the impact of the recession on earnings and what we should make of current earnings forecasts. The chart below shows GAAP earnings as a percentage of sales, including the current forecasts to 2021.

Looking at the last two recessions, we see what we would normally expect. Profits and profitability hit hard, taking about 4 years to return to the levels before the recession. The depth of these earnings recessions corresponds to the depth of the economic recessions, with 2008 being much deeper than the recession of 2001.

If we look at the current recession, the market professionals who forecast earnings and the economy are expecting a completely different outcome. Despite this economic recession being far deeper than that of 2008, in fact the deepest since the Great Depression of a century ago, earnings are not expected to fall far. In addition, they are not just expected to quickly recover to the historic average of around 8%, but back up record high levels of profitability of over 10% before the end of 2021.

Have US companies disconnected from the real economy?

The chart above suggests that the drop in profits so far is entirely consistent with what we would expect in a recession. However the forecasts for profits to return to previous highs within 2 years do not tie up with examining previous recessions. These suggest a much longer recovery of 4 years but also that the current fall in profits may not be over.