
A useful framework for considering one investment is to compare it with another, you can then do analysis to decide if you prefer one to the other. This is of course relative value and if the benchmark asset is government debt, this is a solid place to start.
The “Fed Model”
The “Fed Model” is that the stock market yield is related to the yield on long-term government bonds. Like so many models, it has fallen into disrepute seems to come more from its misuse over the years as opposed to its intrinsic failings.
Expected Returns for Equities and Bonds
A way to start thinking about this model is to start with the expected returns on the two investments, equities and bonds. Consideration of the spread of returns and the distribution around the expected return can come later.
Bonds
Expected return for US government bonds in nominal terms is as easy as it gets – yield to maturity.
I will ignore the remote possibility of a default on the debt.
Equities
Expected returns for equities is harder; there is a choice of possible yields, with none necessarily equating to the eventual return.
- Dividend yield
Problematic given that dividend policy is a management decision. Microsoft’s decision not to issue dividends was not a good indicator of its total return. - Earnings yield
More sensible i.e. E/P (or just PE ratio inverted). - Earnings yield + Inflation
Considering we are using historical earnings, to get a future value we could add an inflation component given that earnings would be expected to rise along with inflation, in the long run.
Testing the expected returns model for Equities
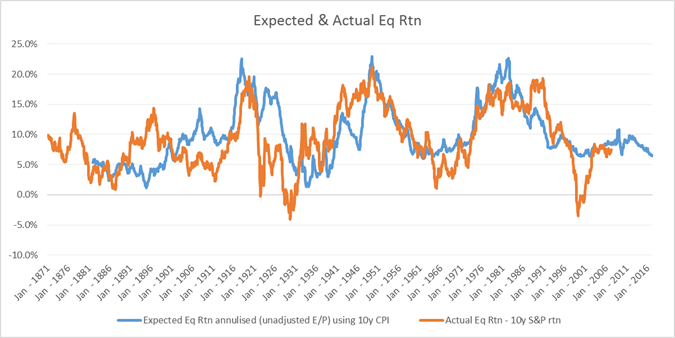
Back-testing expected returns to 10 year actual returns, the US equity market shows surprisingly good results, especially post WW2. This makes intuitive sense as one would expect that buying equities with a lower PE or when inflation is higher would produce better returns. But the strength of the relationship is eye-catching, implying that current earnings do on average provide a good guide to expected equity total returns.
If you come from a purely “efficient markets” view of the world, this may seem blindingly obvious with equity value as simply the present value of the earnings stream. But bear in mind that earnings yield (E/P) is not a yield in the same way that bonds have a yield, unless you make an argument where the word “assume” occurs very frequently.
Expected Returns for Equities versus Bonds
Given that we are happy with our model of expected returns for both equities and bonds, we can move on to comparing one versus the other.
The model for expected return of equities over bonds would look like

We can use data from end 2016 to get actual numbers
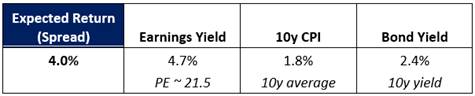
This difference/expected return is often called an equity risk premium (ERP).
We can now back-test its use in predicting if the equity market will actually outperform the bond market. Chart below again shows pretty decent relationship – but can we say how good?
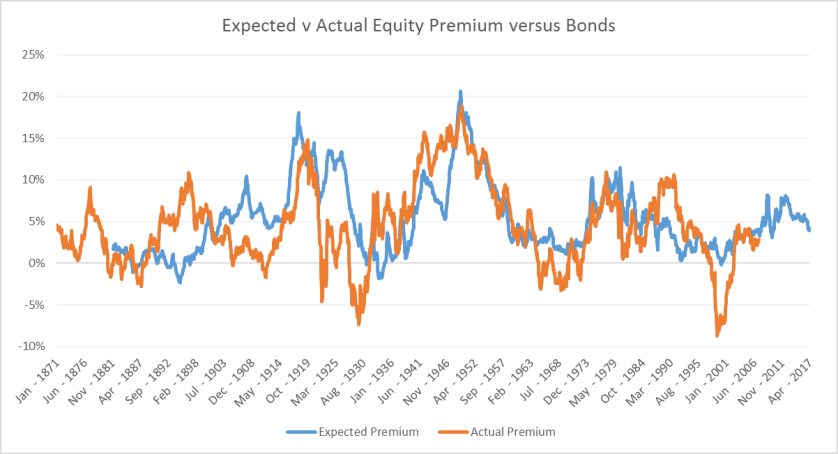
Given the nature of the data we should not perform a regression, and instead here is a truth table for the data back to 1950.

With ex ante premium (i.e. model) above 2%, then equities outperform bonds 93% of the time.
With it below 2%, then equities only outperform 37% of the time. That is a pretty solid result.
Summary
This investigation that equities look cheaper than bonds. If this is the only model you use then the clear imperative is to buy equities now. Before I make my mind up, I want to think about fixed income valuation next.

The KISS principle is too often overlooked as a valid basis for making long term investment allocation decisions. Instead complexity is overbearing and self justifying across every corner of the investment management business. I had a look on Bloomberg and I plotted out the earnings yield of the S&P 500 vs. the 10y yield going back to 1961. What is immediately noticeable is the regime changes across decades — 1960s it looks like today with 10y yields on average 100-200bp lower than earnings yield, in the 1970s the OPEC crisis and inflation inverts this relationship a couple of times and then starting in the early 1980s through 2002 we see a clear period of earnings yield suppressed 100bp or so below bond yields. Ironically its only from 2003 onward that this relationship has again reverted to the earnings yield 200bp premium environment we see today. Ironically, one could argue that in the 1960-1990 period or indeed from 1870-1990 there were few alternatives so the binary choice model of ‘stocks or bonds’ makes some sense and Boolean logic seems an appropriate basis for decision making. Yet from the 1990s forward there are many more choices for asset allocation… I wonder if the ‘spread’ we see in the earnings yield above 10y is more a function of asset selection choice? Typical institutional allocations are often over 50% ‘alternative’ so one could argue this bleeds away investment capital from the two-choice model — most likely at the expense of equities… So perhaps the premium in earnings yield for stocks is a permanent fixture now more as a result of ‘more investment choices’ ??
LikeLike
A couple of questions:
(1) Is the 10y CPI used in the expectations model the 10yr trailing average CPI?
(2) what is the reason for using a 2% threshold in the truth table?
LikeLike
1. Yes it is the 10yr trailing average.
2. the threshold is somewhat arbitrary. if we use 0% which seems logical we get a not very informative data set as it is virtually always over 0% i.e. it is just all the data.
I chose 2% to get a reasonable spread of data in each of the 4 boxes. it also seemed intuitively reasonable as since equities are more volatile and have more uncertain returns you should expect to see a higher yield. what interested me was the extent to which this expectation of a higher yield was followed by a realised higher return.
if we used a 3% threshold instead then the truth table is overwhelming with equities outperforming bonds 99.5% of the time.
perhaps interesting is that in the window 2-3% equities only outperform 75% of the time – but I fear that this is the type of data mining which makes models worse not better. the desire to refine the parameters with this type of data easily leads to compelling and utterly spurious results.
LikeLike