
In previous post (Framework for Equity Valuation Part II – Equity Drivers), we have seen that the PE ratio can be an important medium term driver of equity prices. Given the debatable outlook for aggregate corporate earnings, this makes the outlook for the PE ratio a critical factor in forming a view on equities.
Simple PE ratio
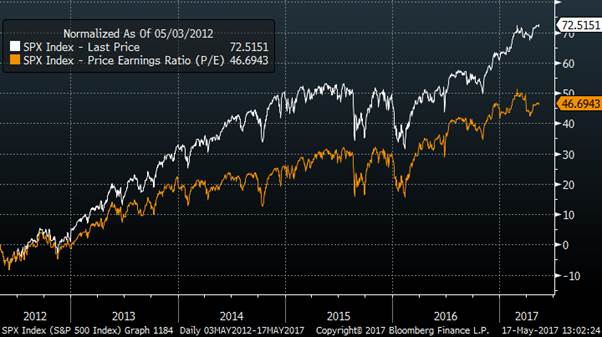
It should be very clear from the normalised chart below that the powerful driver of the equity market performance since 2012 has been an expansion of the PE ratio. The S+P has risen by 72% over that period, and the majority of that is explained by PE ratio which has risen from 14 to over 21, an increase of almost 50%.
Can PE ratios go higher from here?
If we look over the long run, it is very rare for the PE ratio to move higher from where we currently are. In fact, it has only happened 3 times; 1991, 1999 and 2009.
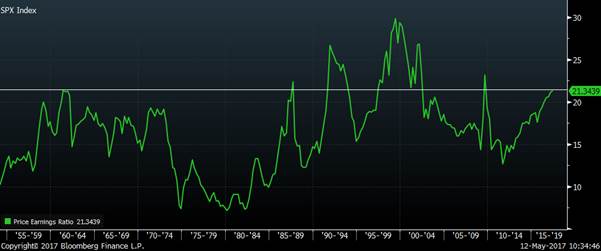
In 2 of these 3 examples, high PE ratios were observed during a recession and ensuing bear market with earnings falling even more than prices . For example, in 2009, the high PE ratio was driven by the collapse in earnings not the soaring of equity prices to record highs. These are not helpful precedents for equity bulls right now.
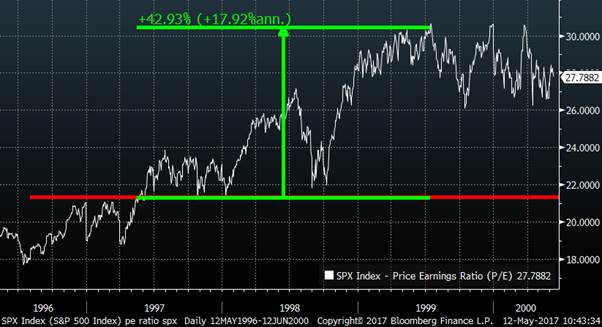
The only previous period where the PE ratio drove the market higher from this level was the dot com bubble. The name given to this period gives a big clue as to what we now think of what happened. If that were to be repeated, then there would be another 40% left in this rally due to PE expansion. This is not impossible but relying on a repeat of the biggest valuation bubble in a century is not reassuring to me.
“Fed Model”
The post I wrote about the Fed model implied that equities represent good value compared with bonds. This generates a counter-argument to my scepticism of a repeat of the dot-com bubble. We have never seen bond yields this low before, so why should we not also see unprecedented low yields in equities (high PE ratio)?
As I explained in my previous post (Framework for valuing equities Part 1- Compared to bonds), I do not think that bonds are good value and so simply beating their performance may not be a high enough benchmark. Most importantly, if QE-driven low yields are pushing up PE ratios, then the termination of QE and rising bond yields should be very harmful for equities.
The other problem is that, even if it is true that holding equities for the next 10 years may work out, the volatility and drawdown you experience may be hard to handle.
For example,
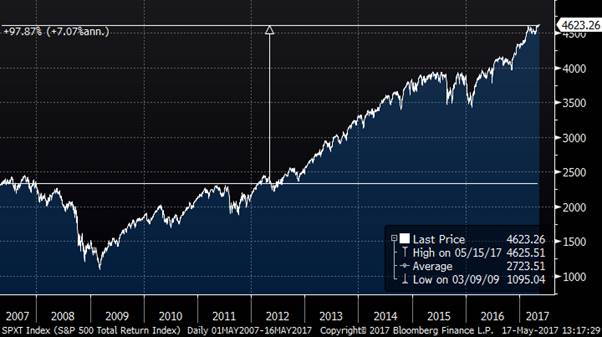
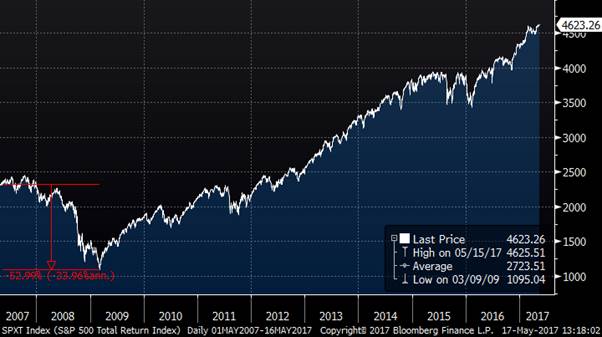
In May 2007 from my equity model (Framework for valuing equities Part 1- Compared to bonds), the expected 10 year return for equities was 8.1% (annualised)
It actually turned out to be 7.1% annualised – which resulted in a total return of almost 100% over 10 years.
That sounds pretty good.
But I bet it would not have felt so good less than 2 years later in March 2009 after a 53% drawdown.
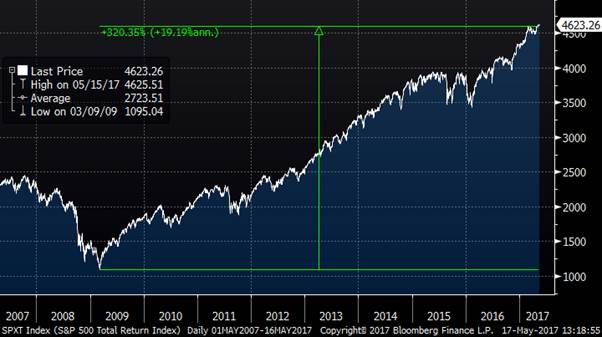
With hindsight waiting for a better moment to enter the long equity trade would have been phenomenally better. If you had waited to buy in March 2009 instead (I know, ludicrous cherry picking, but just about any time around then was great) then your returns would have been a total of over 300%.
Conclusion
The outlook for equities from the perspective of high nominal GDP or high earnings growth look rather limited. Earnings is near record highs as a share of GDP and we are at the stage of the cycle where wages are rising instead.
If we rely on a PE expansion to make us optimistic, we need to be comfortable buying at levels which previously have been associated with a “bubble”.
We can perhaps consider equities being good value compared to bonds, but we must then remember that yields are too low given fundamentals and the termination of QE.
If you are happy to hold them for a decade and do not worry too much about drawdowns, then I come up with an expected annual return of 6.5%. This is higher than bonds right now but perhaps waiting for a better entry level will turn out to be a better strategy.
