Definition
What does the word “significant” mean?
Dictionaries most often suggest a range of closely related definitions.
In a more everyday sense:
- Importance e.g. this new discovery is a significant development
- Meaningful e.g. the significance of the message was not lost on John
In mathematics, you get the example of:
- Significant figures – e.g. 1.524658 is 1.5 to 2 sig fig
This use of the word is mathematical jargon with a precise meaning, but it also tallies with our general use of the word. We only want to look at the digits which are important and mean something.
In statistics:
- “significant” means probably true (not due to chance)
Some issues arise from this
- Something statistically significant may not be important
A result may be true and therefore significant when backed up by statistics, it doesn’t however mean it is important in the more standard English usage sense. I think this statistical interpretation can easily come into conflict with the everyday meaning and is fraught with danger.
When you jump out of a plane without a parachute it is likely that holding up an umbrella has a “significant” effect on your speed. I doubt you would think that this effect was important when you hit the ground.
I’m sure you can think of many things that are probably true but not important!
- Statistical relationships are not transitive
An example from medicine, drugs for the most part are tested against a placebo rather than against each other. Drug A may perform better in tests against a placebo than Drug B. (ie has more significant results) However, that does not mean you know that Drug A will perform better in tests against Drug B. Unfortunately, current medical practice makes this implicit assumption when approving drugs.
This is a common misconception that you can use simple logic to infer other relationships. Unfortunately, this is not true. There is a similarly confused relationship with correlation. Statistical relationships like this are not transitive. https://iase-web.org/documents/papers/isi56/CPM80_CastroSotos.pdf
- The 5% threshold for statistical significance is arbitrary
When you say that one result is significant and another is not because one has a 4.9% chance of being random and the other has 5.1%. This is the correct usage of the technical term but people ascribe more meaning to the word than that. One of the ideas is held to be “true” and the other is discarded.
- A significant result may have happened by random chance
Saying that a certain outcome would only occur 1 time in 20 if it were random sounds good. But what if you ran 20 sets of analysis? By random chance you should expect one of them to pass the “significance” test.
Was the test constructed properly?
This relates to a supremely important point that often statistics are quoted in situations they are not supposed to be used or have been not properly applied
- How many relationships did you test?
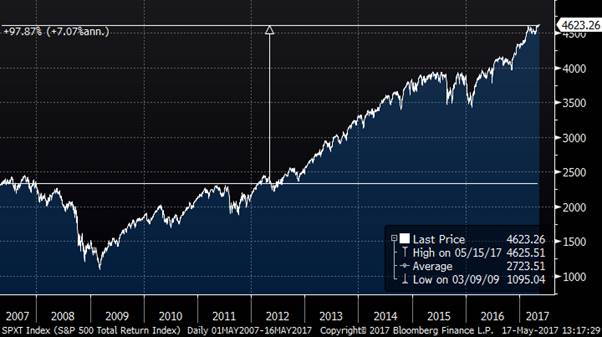
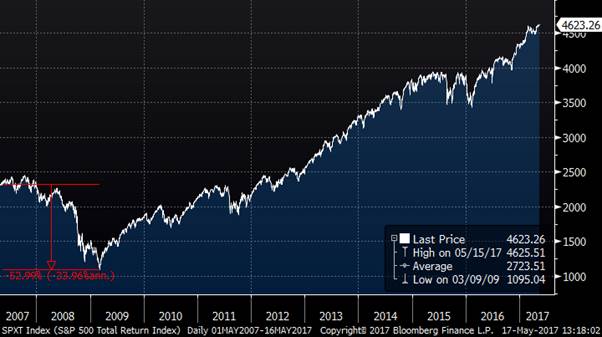
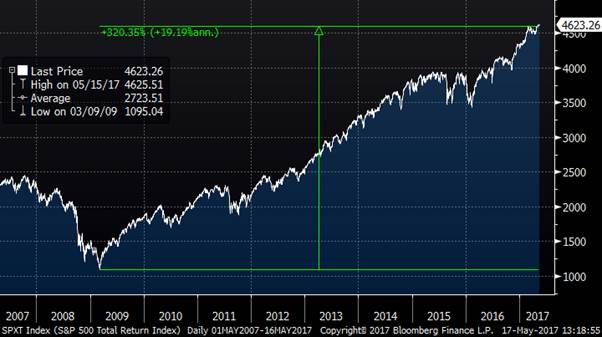
In finance, all analysts look at lots of different data sets, over different time periods in search of something “significant”.
- Did you look at any of the data before choosing what test to run?
I cannot imagine how someone could not fall into this trap. We only run tests on things we think might work. But the reason we think they might work is that we have done some rough statistical work already e.g. looked at a picture or perhaps just subconsciously noted some signs of a relationship. This means that the data has been mined and your choice of test is not independent. - How many people are trying to find these relationships?
Let’s say that you are extremely careful in how you do your statistics. Let’s imagine that everyone else in the firm you work at is similarly careful. Then when you produce a “significant” result you may reasonably think it is meaningful. After all you only ran one test and it worked! You then show your boss. Should she be impressed? Maybe not.
- How many failed tests are not shown?
In my experience, analysts do not show me large quantities of research they have done which they think is completely meaningless. Highly trained with great degrees, they want to show me “good” work with “good” results. This means that the 19 analysts that did not find anything today do not show me anything. From the perspective of the individual the result appears to be strongly non-random. From my perspective, it looks entirely consistent with being random.
Is it meaningless?
No. it just means exactly what the equation says it means. You should remain aware of the context if you want to use it. My interaction with professionals of all types is that they are enormously well trained in the complexity of statistical methods and woefully under trained in the limitations of them. In fact, their high proficiency with manipulating the data and the methods makes them even more prone to methodological error of this type as they have essentially been trained in the art of data-mining.
Conclusion
I am yet to read a research piece from a bank which presents data demonstrating that their hypothesis is has no statistical significance. We should remember that this is significant.