Framework for valuing equities Part IV – PE Outlook

In previous post (Framework for Equity Valuation Part II – Equity Drivers), we have seen that the PE ratio can be an important medium term driver of equity prices. Given the debatable outlook for aggregate corporate earnings, this makes the outlook for the PE ratio a critical factor in forming a view on equities.

Simple PE ratio

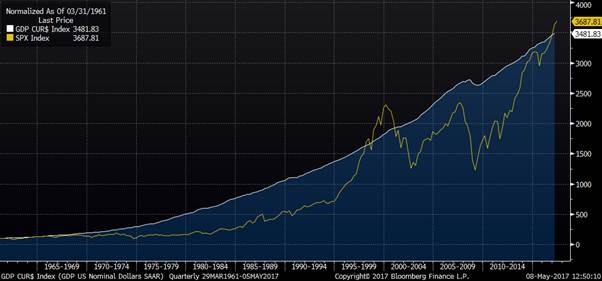
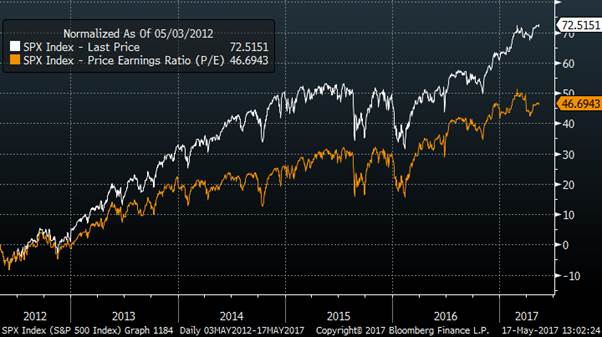
It should be very clear from the normalised chart below that the powerful driver of the equity market performance since 2012 has been an expansion of the PE ratio. The S+P has risen by 72% over that period, and the majority of that is explained by PE ratio which has risen from 14 to over 21, an increase of almost 50%.
Can PE ratios go higher from here?

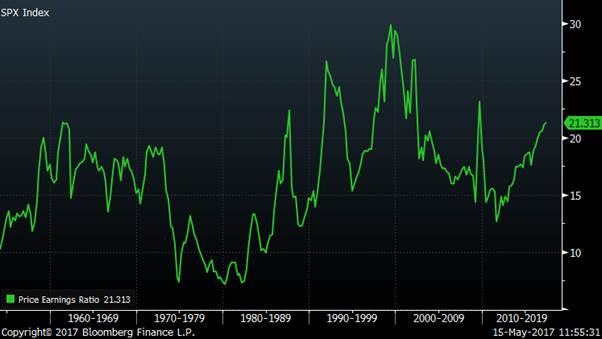
If we look over the long run, it is very rare for the PE ratio to move higher from where we currently are. In fact, it has only happened 3 times; 1991, 1999 and 2009.
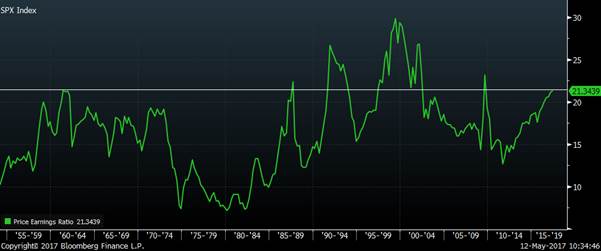
In 2 of these 3 examples, high PE ratios were observed during a recession and ensuing bear market with earnings falling even more than prices . For example, in 2009, the high PE ratio was driven by the collapse in earnings not the soaring of equity prices to record highs. These are not helpful precedents for equity bulls right now.

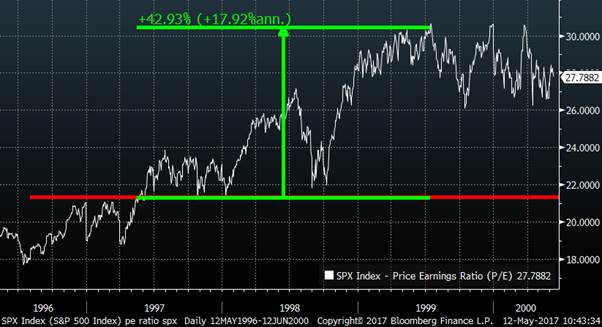
The only previous period where the PE ratio drove the market higher from this level was the dot com bubble. The name given to this period gives a big clue as to what we now think of what happened. If that were to be repeated, then there would be another 40% left in this rally due to PE expansion. This is not impossible but relying on a repeat of the biggest valuation bubble in a century is not reassuring to me.
“Fed Model”

The post I wrote about the Fed model implied that equities represent good value compared with bonds. This generates a counter-argument to my scepticism of a repeat of the dot-com bubble. We have never seen bond yields this low before, so why should we not also see unprecedented low yields in equities (high PE ratio)?

As I explained in my previous post (Framework for valuing equities Part 1- Compared to bonds), I do not think that bonds are good value and so simply beating their performance may not be a high enough benchmark. Most importantly, if QE-driven low yields are pushing up PE ratios, then the termination of QE and rising bond yields should be very harmful for equities.

The other problem is that, even if it is true that holding equities for the next 10 years may work out, the volatility and drawdown you experience may be hard to handle.

For example,
In May 2007 from my equity model (Framework for valuing equities Part 1- Compared to bonds), the expected 10 year return for equities was 8.1% (annualised)

It actually turned out to be 7.1% annualised – which resulted in a total return of almost 100% over 10 years.
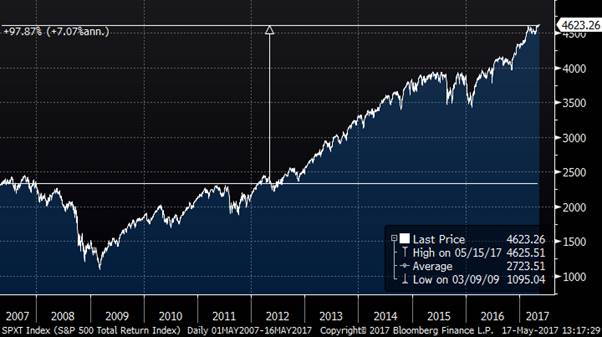
That sounds pretty good.
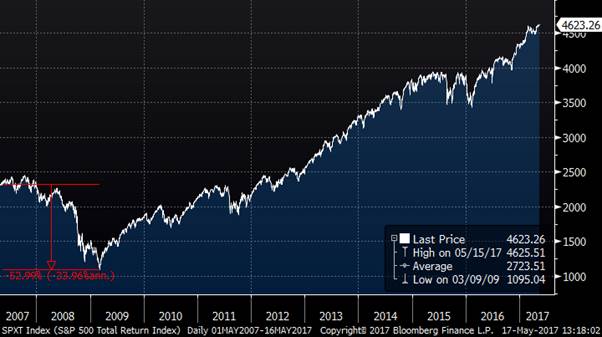
But I bet it would not have felt so good less than 2 years later in March 2009 after a 53% drawdown.
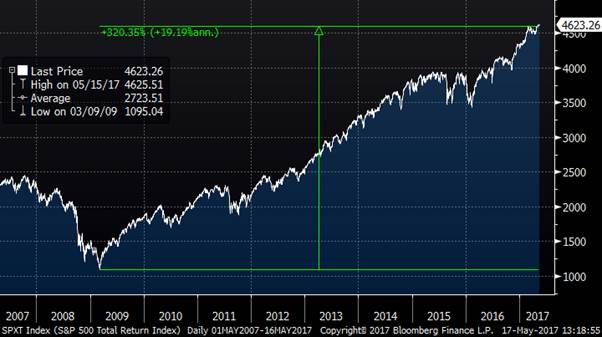
With hindsight waiting for a better moment to enter the long equity trade would have been phenomenally better. If you had waited to buy in March 2009 instead (I know, ludicrous cherry picking, but just about any time around then was great) then your returns would have been a total of over 300%.

Conclusion

The outlook for equities from the perspective of high nominal GDP or high earnings growth look rather limited. Earnings is near record highs as a share of GDP and we are at the stage of the cycle where wages are rising instead.

If we rely on a PE expansion to make us optimistic, we need to be comfortable buying at levels which previously have been associated with a “bubble”.

We can perhaps consider equities being good value compared to bonds, but we must then remember that yields are too low given fundamentals and the termination of QE.

If you are happy to hold them for a decade and do not worry too much about drawdowns, then I come up with an expected annual return of 6.5%. This is higher than bonds right now but perhaps waiting for a better entry level will turn out to be a better strategy.
Framework for Equity Valuation Part III Earnings Outlook

We explored in the last post (Framework for Equity Valuation Part II – Equity Drivers) how earnings as a share of GDP can be an important driver of medium term equity returns.


What is the market expecting earnings to be?

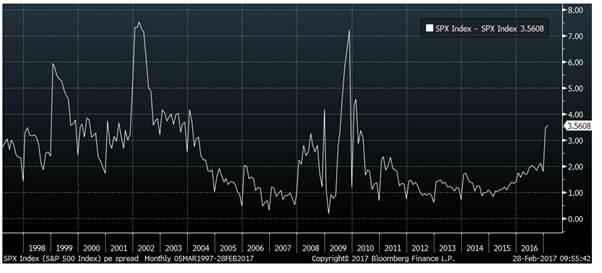
The chart below shows the difference between what the PE ratio is today and what it is expected to be in a year’s time (i.e. a measure of what analysts expect total earnings growth to be). Currently it shows that equity analysts are predicting a 20% increase in corporate profits. This implies that although the current PE ratio may be high, it will be brought down by rapidly rising earnings.

I find this chart is the best explanation of the Trump rally. Analyst earnings expectations rose immediately and this is temporarily reflected in a higher PE ratio. Once the earnings come through we will see that the rise in equities was driven by earnings not by animal spirits. Assuming the analysts’ earnings optimism is correct of course.

What does this mean for earnings over GDP?

I will leave aside for now views on how effective Trump will be at increasing growth and just look at the confidence level implied in market prices. It is all too easy with controversial political figures and issues for analysis to become infected with partisan assumptions and desires which lead to worse decisions.

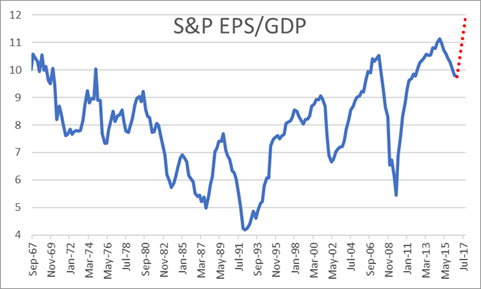
The first point to note is that taking analysts expectations of a 20% earnings increase, this would imply earnings as a share of GDP will immediately rebound to all-time highs (dotted red line in the chart we used previously). We have seen drops in E/GDP of that magnitude before during recessions but never an increase and this seems an odd stage of the cycle to expect it.

Is this forecast consistent with other data?

Another useful way to use national income data is split the economy into just 2 parts – Wages and Profits.

The National Income Accounts (NIPA) data is used a lot more by economists than it is by market participants. To give some context, it was particularly useful to use during the late stages of the dot com bubble, as it showed that reported earnings were far in excess of the profits seen in the national accounts. This implied some form of earnings inflation and potentially even fraud, which actually did come to light later in 2002. The chart below shows how the reported earnings diverged for 4 years before coming back in line very sharply. Checking reported data and forecasts for simple internal consistency can be surprisingly rewarding. It is best not to assume that analysts have done this for you.

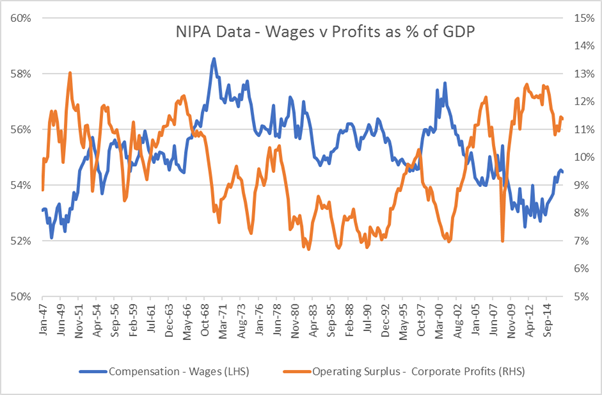
Using the National Income Accounts data, we can construct a chart of the respective shares of national income for wages and profits. As you can see, there is a clear and logical inverse relationship between wages and profits as a share of GDP.

We know that wages have finally been rising again recently and all forecasts are that this will continue. So how can we have nominal GDP of 4%, wages rising at least 2.5% and profits rising 20%.

Quick answer – we can’t.

Long answer – it requires some heroic assumptions in other parts of the national accounts which I won’t go into here.

Scenario – if we assume corporate earnings will rise by 20% over the next 12 months and allow the other components of GDP (including proprietors’ income) to grow at 4%, we can solve for wages and we get an increase of just 0.7%. Rather different from the 2.5% current seen in average hourly earnings.

Summary

There is a great deal of optimism among analysts for the outlook of corporate earnings. It is hard to reconcile that with some basic arithmetic from the national accounts. When nominal GDP growth is moderate and wages are accelerating, it is hard to also get record increases in corporate profits. If earnings do not rise as rapidly as anticipated then to be optimistic on the S+P you need to be positive on the prospects for PE expansion. I will look at that next.

The ethics of climate change

The ethics of climate change raises the most difficult questions.
I am not writing an environment blog, but to get a sense of the difficulty of the philosophical issues, here are some of the big questions:

  1. Intergenerational transfers
    The costs are borne by people alive today for the benefit of people who are not yet born. How do we balance the interests of those two groups?
  1. Democratic Mandates
    Is a country run a by a government with a mandate to look after the current population? Or for the long-term future of “the country”?
  1. Historical Emissions
    Should historic carbon emission be allocated to countries?
    Is the nation state the bearer of historic liabilities from the activity of its deceased former inhabitants? Do new immigrants take on this liability?
  1. Developed versus Developing economies
    How do we balance the desire for developing economies to grow into developed ones and the West’s desire to stay wealthy with a decline in carbon usage?
  1. Is Carbon a right or a consumption good?
    Is carbon usage a consumption good like any other i.e. the rich get more of it
    or is it a human right in which every person on earth has an equal right?

It’s interesting how infrequently these issues get discussed in the public debate, which focuses primarily on the technical models or measurement issues. It is also striking that an issue like Climate Change can so accurately be characterised as partisan issue of political left vs right. That Trump wants to withdraw from the Paris Agreement or that Bernie Sanders supports environmental action is not surprising. This predictable difference cannot be explained away by describing your opponents as crazy, it is more likely to come from a deeper difference of view on the underlying ethical issues.Whenever I hear a climate scientist claiming authority and opining that the science indicates a particular policy path, I feel that they have just not understood how difficult this problem is. They generally have no expertise or authority in anything other than a narrow field and like all of us bring our personal ethical values to the debate. When scientists unknowingly embed their ethical views into their scientific views it makes it far easier for their opponents to criticise the science.

Science is important but philosophy matters too.

Framework for Equity Valuation Part II – Equity Drivers

In previous posts, I have written up ideas on primary drivers and first approximations for fixed income and foreign exchange markets, and I now want to continue with equity markets (Click here for Framework for valuing equities Part 1). This is a little more complex to explain so will take a few posts to go through the steps.

Most equity analysis I read starts from the bottom up. The analyst knows a lot about individual companies or sectors and will extrapolate from there to the broader index. Or if some macro analysis is performed, it assumes some form of “conventional wisdom” such as high growth means higher equities.

I want to start with a top-down equity valuation and so I find a useful way to begin is to break the equity price into components. Then I can compare equities to GDP and the economy, things that I am familiar with already.

This framework can be applied to all equity markets but will start here with the US and the S+P 500.

Breakdown of the Equity Price

Using some very simple algebra:

Price = (Price / Earnings) * Earnings

Price = (Price / Earnings) * (Earnings / Nominal GDP) * Nominal GDP


Focus on the Components

Eventually, I will I look at how these variables relate to each other, but first let’s start examining each in turn:

  1. Nominal GDP Long Term Diver
  2. Earnings Medium Term Driver
  3. PE Ratio Medium and Short Term Driver
  1. Nominal GDP 

In the long-run, Nominal GDP is the only thing that matters for equity prices.
Nominal GDP is 35 times bigger than it was in 1961 and the S+P Index price is 37 times higher. Fundamentally, if you are a long-term investor and just stay long equities, then the rising tide of growth will lift you to large compounded returns over the decades.

However, if your horizon is less than decades, nominal GDP is not such a clear driver of equity returns. In the very short run and even in the medium term of say 2 years, nominal GDP moves far less than equity prices do.

Follow-up Question “Does outlook for nominal GDP matter now for investment decisions?”

See later post

  1. Earnings as a share of GDP

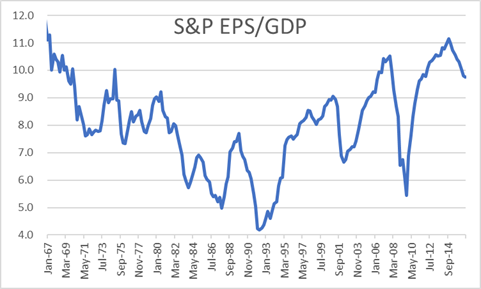
Below is the chart from 1967 to now. Over a given 2-year horizon, we have seen material movements in S&P trailing EPS over GDP. Many are interesting, but the recent financial crisis moves stand out the most. Earnings were clearly volatile but amid the talk of bubbles, panic, and recovery of confidence, how important were they versus other drivers?


Example – Financial Crisis and recovery

During financial crisis earnings dominated.
For all the talk of animal spirits and how equity markets were highly erratic and emotional, the “boring” fundamentals of corporate earnings explained practically all price movements.

Follow-up Question “Outlook for earnings?”

See later post

  1. PE Ratio – Medium and Short term driver

Short term

In the short-run by definition PE ratio is the only thing that matters.
GDP data and earnings releases are only quarterly and so, for most days, the only thing that could have changed is the PE ratio.

You may argue that these daily changes in PE ratio are explainable and even predictable as they are driven by

i) Change in expectations of earnings

ii) Change in expectations of nominal GDP

iii) Change in yields in other substitutable markets

iv) Change in yield demanded from equities due to change in risk preferences or change in perception of risk

Radio and TV programmes are filled with a succession of strategists and pundits all required to “explain” yesterday’s market movement and these factors are therefore reached for repeatedly.

Unfortunately, these short-term changes are all too easy to explain away, given the limited range of explanations that are permitted. But you can tell that these “explanations” are also very hard to predict. The driver that is sometimes assumed is that the PE ratio change is due to rational updating of forecasts of GDP growth and corporate earnings. But markets are too volatile and erratic for that explanation to be compelling and talking about animal spirits is more natural.

Medium term

From the chart below you can see that the PE ratio is broadly unchanged over the past 50 years i.e. it is not at all a long-term driver of equities. But it is also clear that with a range of 7 to 30 it can have a huge impact on medium term price movements.


Example – 1980s

In the 1980s, for all the talk of the transformation of the US economy through the Reagan/Volker years combined with the “Greed is Good” era unlocking corporate value through increased efficiency, it was neither high GDP growth nor rising earnings that dominated the dramatic rise in equity prices. In fact, earnings as a share of GDP fell during this period and it was the rise in the PE ratio that drove prices higher.

One can think of this as a yield effect from the fall in inflation and the subsequent drop in bond yields. Lower bond yields drove yields lower in all asset classes, including property and equities. Lower yields mean higher prices and so we saw a huge bull market, commonly mis-explained by deregulation and improved business management.

Example – 2013 to now


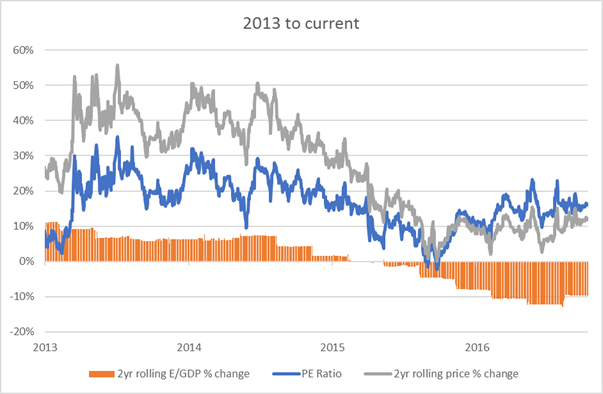
Over the past 4 years, the dominant driver has again been the PE ratio. Despite more confidence in the recovering economy, earnings as a share of GDP has not risen.

Again there has been a the yield effect with QE reducing yields in the bond market (https://appliedmacro.com/2017/05/23/framework-for-valuing-fixed-income-long-end/) and this has slowly filtered into other asset classes, such as equities, reducing yields and increasing prices.


Follow-up Question “Outlook for PE ratio?”

See later post

Conclusion

The framework of separating nominal GDP, earnings and PE ratio is helpful in describing what have been the historic drivers of equity markets. What we can do next is look at the current outlook for each of these drivers and from that the outlook for US equity markets.