Framework for valuing equities Part I- Compared to bonds

A useful framework for considering one investment is to compare it with another, you can then do analysis to decide if you prefer one to the other. This is of course relative value and if the benchmark asset is government debt, this is a solid place to start.

The “Fed Model”

The “Fed Model” is that the stock market yield is related to the yield on long-term government bonds. Like so many models, it has fallen into disrepute seems to come more from its misuse over the years as opposed to its intrinsic failings.

Expected Returns for Equities and Bonds

A way to start thinking about this model is to start with the expected returns on the two investments, equities and bonds. Consideration of the spread of returns and the distribution around the expected return can come later.


Bonds

Expected return for US government bonds in nominal terms is as easy as it gets – yield to maturity.
I will ignore the remote possibility of a default on the debt.

Equities
Expected returns for equities is harder; there is a choice of possible yields, with none necessarily equating to the eventual return.

  • Dividend yield
    Problematic given that dividend policy is a management decision. Microsoft’s decision not to issue dividends was not a good indicator of its total return.
  • Earnings yield
    More sensible i.e. E/P (or just PE ratio inverted).
  • Earnings yield + Inflation

Considering we are using historical earnings, to get a future value we could add an inflation component given that earnings would be expected to rise along with inflation, in the long run.

Testing the expected returns model for Equities

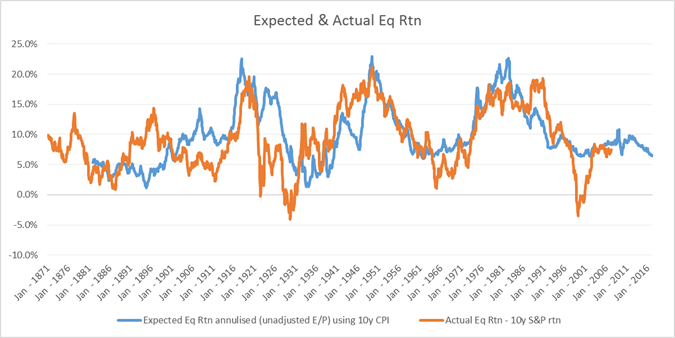
Back-testing expected returns to 10 year actual returns, the US equity market shows surprisingly good results, especially post WW2. This makes intuitive sense as one would expect that buying equities with a lower PE or when inflation is higher would produce better returns. But the strength of the relationship is eye-catching, implying that current earnings do on average provide a good guide to expected equity total returns.

If you come from a purely “efficient markets” view of the world, this may seem blindingly obvious with equity value as simply the present value of the earnings stream. But bear in mind that earnings yield (E/P) is not a yield in the same way that bonds have a yield, unless you make an argument where the word “assume” occurs very frequently.


Expected Returns for Equities versus Bonds

Given that we are happy with our model of expected returns for both equities and bonds, we can move on to comparing one versus the other.

The model for expected return of equities over bonds would look like

We can use data from end 2016 to get actual numbers

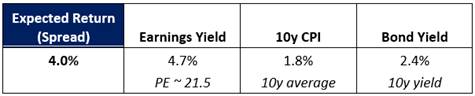
This difference/expected return is often called an equity risk premium (ERP).

We can now back-test its use in predicting if the equity market will actually outperform the bond market. Chart below again shows pretty decent relationship – but can we say how good?

expected vs actual

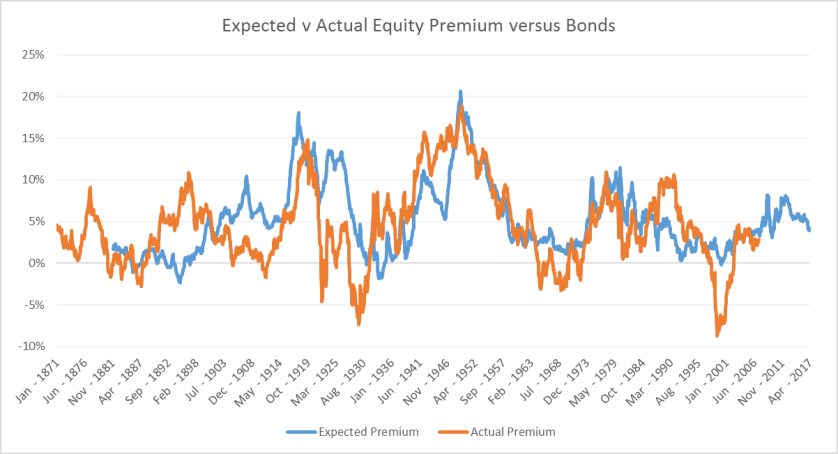
Given the nature of the data we should not perform a regression, and instead here is a truth table for the data back to 1950.

With ex ante premium (i.e. model) above 2%, then equities outperform bonds 93% of the time.
With it below 2%, then equities only outperform 37% of the time. That is a pretty solid result.

Summary

This investigation that equities look cheaper than bonds. If this is the only model you use then the clear imperative is to buy equities now. Before I make my mind up, I want to think about fixed income valuation next.


Government Debt Framework – UK Follow-up

Relevance to the present

Previously, we looked at the UK government debt in the post WW2 period.

Two clear questions arise –

“How did the UK manage to keep its rates so far below nominal GDP?”
“Should we expect to be able to do the same in the future? “

The key to inflating away national debt is the ability to force domestic investors to hold government debt at well below the yield they would get in a free price-setting environment.
Sometimes this is reported as financial repression.

Again, this paper does a really good job of giving the details of the post WW2 period. https://www.imf.org/external/np/seminars/eng/2011/res2/pdf/crbs.pdf

Comparison post WW2 period to Current

I am interested in the extent to which the situation could be the same for other countries today.
My bias is that it would be significantly more difficult and we should not assume that because it worked in the 1950s it will work today.

  1. Ability to force domestics to hold govt debt
    This is probably the easiest and we are seeing plenty of this at the moment.
    e.g. pension funds and banks being required to hold government debt for “liquidity” or “prudence”

But the danger of the current system is leakages

  1. Capital controls
    Post war Bretton Woods we had globally imposed coordinated capital controls that reinforced home bias. In effect, countries agreed not to compete for capital through the price mechanism. I see this as a form of cartel which managed to hold together until the 1970s. We are a long way from that kind of cooperation today.
  1. Ownership of debt
    It is much easier to coerce domestic investors than foreign ones. In many heavily indebted countries, the issue is that debt markets are owned by foreign investors. This was a big factor in the Asian crisis of 1997/8 and the Mexico crisis of 1994. Currently, the Gilt market is 25% owned by overseas investors which makes it perhaps a little vulnerable. In contrast Japan has a higher debt level but virtually all the debt is owned by domestics.
  1. Trade surplus/deficit
    Post WW2, the UK was close to balance and now has a large deficit (over 4%). This deficit needs external funding which currently comes from FDI. All this adds extra pressure and vulnerability to the situation.
  1. Sensitivity of average rate on the of debt
    In ideal world, the debt market would be structured as conventional Gilts with as long tenor as possible whilst running a primary surplus to offset the interest payments. Even if short rates and inflation rose, the rate paid on the debt would stay the same thus somewhat mitigating rollover risk or the risk of paying much higher rates overall. Unfortunately, this is not the case in most developed countries as QE has been making situation worse.

QE shortens duration of the debt market

One way to think of QE is as a shortening of the duration of debt issuance (another post I think) then the impact on the debt profile is to significantly shorten it. In this light, QE on the Bank of England’s balance sheet simply means that rather than having a £435bn liability of long duration it is paying overnight rates on bank reserves. When (/if?) the Bank raise rates then they are immediately paying higher rates on the debt. (note debt and liability mean the same thing here).

Below is a chart of the average duration of the Gilt Market since 2000

image0011


Final Thoughts

I have frequently read the argument that we can inflate our way out of our current debt problems by having faster growth and inflation. The obvious flaw in this argument is it requires independence of nominal GDP growth and interest (i.e. Central Banks would not raise rates in the face of higher nominal growth which is clearly not the case). In the modern market economy, nominal growth and interest rates are highly related and so just assuming they are not is both bizarre and surprisingly common. Alternatively, you can concede that there is a link between growth and interest rates but remain very confident in the ability of modern nation states to impose financial repression with no leakages.

From my understanding of the modern financial system, I do not share that confidence that current debt levels can be easily reduced and therefore, I do not think they can be raised with impunity. It does not however follow that I become an austerity-hungry debt and deficit hawk.

This debate that I read between economists and political commentators appears depressingly partisan with far more noise and anger than analysis. What really matters is whether the current situation is risky enough to merit policy action or, as investors, some active asset re-allocation. This is highly complex but in my view, economic analysis is falling short in its ability to help. If your answer to the question of whether government deficits should be higher or lower is the same at all times, across all countries, then I would suspect that your economic model is not going to be very helpful in making policy or investment choices.