
In my previous post How to reduce your risk? –
If you chose A please click here.
If you chose B please click here.
A full explanation of the answers to follow in a later post.
In my previous post How to reduce your risk? –
If you chose A please click here.
If you chose B please click here.
A full explanation of the answers to follow in a later post.
If this blog were the BBC, in an effort for impartiality, I would give equal time to 2 ideas:
However, I’m not bound by any such desire for manufactured impartiality so would like to ignore climate denial theories. I want effective action to be taken and I’m interested in why the first argument is failing to find broad enough support against those who want to dismantle the Paris Agreement.
The Science
I think I can reasonably simplify the scientific arguments to this:
The criticisms for each item can be summarised like this:
The responses I have seen to these criticism from climate change scientists are:
Coming from a macroeconomics background, the criticisms wouldn’t bother me much. We face them all the time. The responses from the climate change scientists do bother me however. If this reflects their research programmes, I fear they are heading in the wrong direction, sharing many of the methodological problems we see in macro and likely making the same mistakes.
My view
My preferred responses to the criticism would be
The good news is that we do not need accurate forecasts because:
Financial markets can be a very good training ground for learning about practical model building and their methodical dangers. Most of us have been seduced by beautiful models with great back tests with desirable correlations and high Sharpe ratios. But then trying to use them to make money, we find they had no predictive qualities at all. After enough painful experiences, we learn to be highly suspicious of any model that fits the data too well – it is the obvious symptom of data-mining. The models that work in practice are the ones that are intuitive, simple and accept that the world is a messy complicated place.
What climate change scientists and macro-economists can actually do have a lot of similarities. We do not know what the temperature will be on October 23rd 2087 but we have a good guess it will be higher if there is more carbon in the atmosphere.
In a previous post, we looked at a model of relative value of equities versus bonds (https://appliedmacro.com/2017/05/09/are-equities-expensive-part-i/).
But it does beg the question of whether bonds are good value themselves.
I am not aiming for a full review of global bond value, I will focus purely on the US market. In this post, I shall look at the front end of the curve and in a later post the long end.
Expectations
The simplest and best model for the short end of the yield curve is the expectations hypothesis.
The yield is an average of short-term interest rates that are expected to prevail through the life of the security

Such expectations may not match the market yield, so there may be a residual. This residual r is sometimes called the premium (choose any: risk premium, term premium, liquidity premium, it does not matter which). At times such as during the financial crisis, I spent a long time modelling precisely the premia, but in normal market conditions it’s not very productive. Merely knowing if the premium is large or small, positive or negative is sufficient.
The other term often used for premium is expected return. If you think in terms of academic “efficient market” models or asset allocation in a real money environment, then you may prefer to use excess return but the language does not matter here.
US Front End
In the US, the Federal Reserve effectively sets short term interest rates, the Fed Funds rate, and these days they helpfully publish quarterly forecasts of where the committee thinks it will be. A sensible starting point is to compare these forecasts to the tradable yield and calculate the residual.
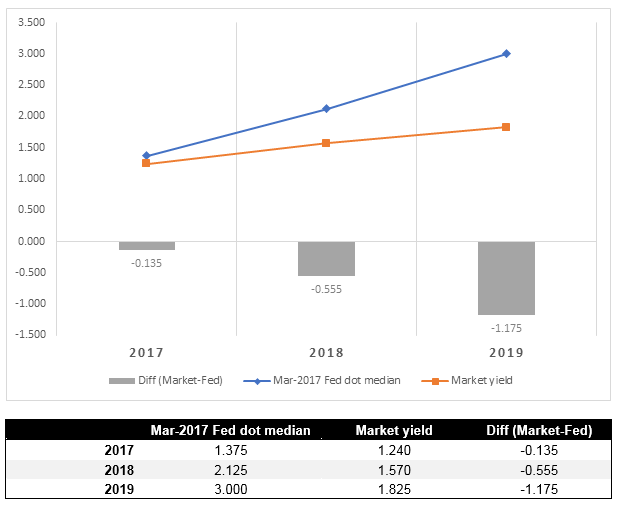
If you have not been following fixed income markets for the last few years or have learnt how markets work from finance textbooks, you may find this chart surprising.
We, as market participants, are well used to the fact that the market is pricing that rates will be significantly lower than the people who set them expect them to be. This has been the case for a long time but so far, the market has been better at predicting how the Fed will behave than the Fed itself.
If we look at a chart over the past 2 years where rates have been expected to be at the end of 2018, we see some fluctuations but very little net movement. In contrast, the Fed has been consistently revising lower its forecasts of where it thinks rates will be.
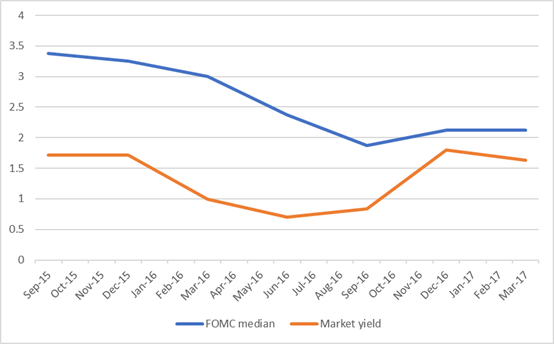
If we cannot just assume the Fed know what they will do, we must form our own opinion on where rates might go and determine whether the market is under or over pricing the path. The way to do this is to break down the elements of the forecast and analyse each of them.
The Fed’s reaction function & the Taylor rule
To start with the obvious, the Fed decision can be thought of as a function of things they care about. It is often called their “reaction function” and the things they care about are employment and inflation, their explicit objectives as given to them by Congress.
A common and useful form of this is the Taylor rule, which models Fed behaviour on just two variables.

Using this to make investments
The Taylor Rule is not that useful as a predictor of rates, but it forms a useful framework to think of what drives them.
There are 3 obvious places where you can disagree with the market and so make an investment call.
One of the largest and most obvious trades in my career was short term rates in 2002. The economy had been very poor in 2001, but the memory of the bubble was perhaps still so vivid that the market priced a rapid rebound in growth and thus interest rates. 2002 did not turn out to be the year of recovery and rate expectations fell accordingly all year.

A good example of this would be 2008. Even after Lehman went under in October 2008, it took a long time for people to understand how serious it was and the devastating impact on the broader economy. The market was still pricing that rates would be nearly 3% at the end of 2009. They ended up close to zero. Rates eventually plummet in 2008 because the economy is falling apart.

A counter-example where a commonly believed idea turns out to be wrong is the idea that Quantitative Easing (QE) is going to lead to high inflation and so bonds will collapse. This comes from the idea that inflation is caused by “money” and the Fed is “printing money”. A simple and appealing argument that comes from a misunderstanding of what “money” is and how the monetary and banking system works. (a good topic and controversial later post I am sure).
An example here would be that after the crisis many people were very premature in thinking that the economy would get back to normal.
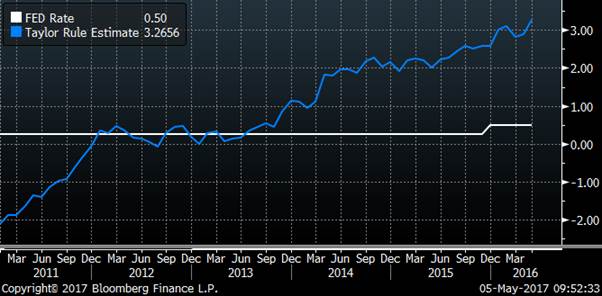
In the summer of 2013, rates were still zero and the Taylor Rule suggested that was appropriate. But taking the economic forecasts at the time and projecting what that meant, suggested that rates would be much higher. So back in 2013 the market was pricing that rates would currently be about 3 %. In fact they are around 1%.
This difference is not because the economic growth forecasts were wrong. But the reaction function was. If you listened to Fed Chair Yellen’s speeches she was clear that the Fed would be very “patient” in raising rates. They desperately wanted to avoid hiking prematurely and actually wanted inflation to be higher. So a new reaction function should have been understood – that the Fed were waiting longer to hike to get the economy to be running hotter.
What about now?
My experience of financial markets is that is that expectations are more commonly adaptive than rational. By this I mean that humans (including market participants) tend to overweight recent experience. Given that the Fed has been consistently too high in their forecasts for the last few years, people expect that will continue to be the case. I am not so sure.
I am inclined to use an even simpler new reaction function for the Fed based upon wages. In previous cycles, they would hike before wages rose because
This time they want wages and inflation to be higher before they even start. The data suggests to me that wage growth is finally recovering.

It is reasonable to think that the economic cycle works the same now as in previous periods, and so wages are a lagging indicator. That means that the labour market has been tight for a while now and is continuing to get getting tighter adding more upward pressure on wages.
Conclusion
This cycle has been very different from prior periods because
This has meant that being long the front end has been a reasonable trade for a long time i.e. the front end was cheap against my expectation of where the Fed would set rates. But with the signal that wages are finally rising, we may be approaching the end of this phase. Furthermore, with so little still priced for rate hikes from the Fed the front end does not look good value to me.
If the US recovery has been slow, but the economy not long-term impaired then this means that the rate cycle has been delayed, not that it is not coming or that where rates end up will be so much lower than in previous cycles. But that is the topic for the next post.
“when you have eliminated the impossible, whatever remains, however improbable, must be the truth” – Sherlock Holmes “Sign of the Four”
I am a Sherlock fan but I am afraid this statement is nonsense and reflects a common error in how we make decisions. The statement above is incorrect because what is left after eliminating the impossible is not only the improbable ideas you have, but also all the ideas you did not come up with. It is more likely that the answer is something you did not think of because you limited your possibilities too early in the process.
I saw a good friend of mine this week who has been very worried for the past two weeks about a business problem. He had put a lot of time and energy into preparing a space to display artwork, but now it seems the lease might fall through due to issues beyond his control. He appeared stuck in a loop, thinking he had no control of this situation. I suggested we use an approach that I use all the time when looking at investment ideas.
If you go back to my first 2 posts you can see the same basic idea.
To be creative you need to separate the idea generation phase from the analytical evaluation phase.
I hope to use this blog over time to share some of my investigations of ideas which even I may think hard to justify. But to come up with really good ideas, you have to be willing to entertain a lot of really bad ones.
“It is a capital mistake to theorize before you have all the evidence. It biases the judgement.” Sherlock Holmes “A Study in Scarlet”.
Well said Sherlock.

