In my previous post, I discussed how the common use of the word “gambling” mixes up volatility with randomness, and frequently leads to incorrect assumptions about skill.
Another perspective on gambling is examine people’s motivation.
Why do they do it?
There are four main motivations I can think of why people gamble
- For the excitement, the drama of winning and losing
- To add some interest to an activity
- To deliberately add volatility to an outcome
- To make money consistently
Volatility and expected value
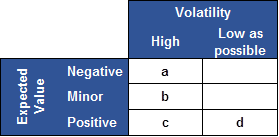
Here is a framework with two dimensions “Expected Value” and “Volatility”.
Positive expected value is when you expect on average to make a profit
Negative expected value might be called “against the odds”.
High volatility means that the short-term outcome is highly uncertain
Low volatility means the outcomes are far more tightly distributed.
a. Excitement e.g. playing in a casino
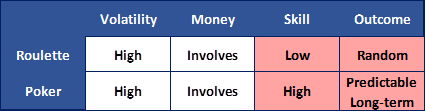
This is the activity that most often comes to mind when we think of gambling: playing roulette in the casino, betting on horse racing. The desire to induce a feeling of vertigo is the primary purpose. https://www.youtube.com/watch?v=TAaSJcIIruI
A key element to this form of gambling is that it has a negative expected value i.e. you lose on average. It is well known that casinos design their games to produce exactly this i.e. the house advantage. The player gets the excitement coming from high volatility; they will lose on average but they might win big tonight!
These games tend to be low skill. There may be a skill in minimising losses but this tends to reduce the volatility or “fun” element. For example, playing Blackjack with Basic Strategy, not difficult to learn, but extremely boring to play as every decision is pre-determined.
This motivation is very common but although I understand it, I do not really enjoy it myself. A low skill game, in which I expect to lose on average, sounds dreadful.
b. Adding interest e.g. betting on a football match you are watching
This is the form of gambling that I think of when I am engaged in an activity, and people say to me they want to “make it interesting”. We might be watching a football match, or playing golf together. There is an underlying activity but it can make it more fun if a monetary aspect is added.
Some people really like this and I think it’s because they really enjoy the gambling aspect i.e. they get to combine an activity they enjoy with gambling which they also enjoy (much like a. above). It could also be that they find the underlying activity a bit dull and want to add something to it to make it worthwhile. They want to experience the feeling of vertigo and having some “skin in the game” will induce or magnify that feeling.
But perhaps the important idea is that it means spectators have a reason to personally care. They are not just watching other people play a game, they have something that means that the outcome directly affects them.
c. Add volatility
This is an interesting category to me. This is where it is important to add volatility to a result and the impact on the immediate expected value is not so important.
Some example may help to clarify what I mean:
i) You owe a loan shark £10k and if you do not pay up in full tomorrow you will be killed. You only have £5k. A good plan is to walk into a casino and put £5k on black (or red). The fact that the bet itself is slightly negative expected value is irrelevant in the broader context.
ii) You are playing chess and are doing badly, perhaps simply down a pawn or two. If you carry on as you are playing sensible moves you will very likely lose. A good strategy here may be to embrace complexity; adding complexity to the board increases the chance of a mistake from either side and may outweigh the initial advantage. Conversely if you are winning, then the simplest route to victory is best i.e. a clear technical win rather than a beautiful attack.
iii) It is the end of a movie and to defeat the monster/get the guy (or girl) /win the game etc the hero acts in a way which is highly likely to fail, but if it succeeds will end in triumph.
What is interesting about this form of “gambling” is that it is highly rational, but only applies in specific situations. If these situations were to repeat, then the expected value and volatility would be highly damaging. Unless of course you are in a Fast and Furious sequel.
d. Make consistent profits
Professional poker players or expert traders/investors fall into this category. They expect to win on average, but accept in the short term they might not. They would prefer to minimise volatility, as they are not engaging in the activity for the excitement and drama, but to make a profit. The volatility is just a price to pay for the longer-term profits.
An aspect of this that is really interesting to appreciate is the extent to which a person who is primarily motivated by winning is usually trying to minimise the feelings of excitement and vertigo. Top sports people train themselves with exercises such as breathing techniques and mental training to disengage their emotional brain as it generally leads to worse performance. Just think about golfers under stress missing short putts or footballers missing penalties in a shootout. It is the same for poker players. The amateur loves the drama but the professional is doing a job.
It is debatable whether this category of wanting to make consistent profits should be even classified as gambling.
Different people have given me clear and differing views. My view is that calling it gambling is very misleading.
This category is exactly the OPPOSITE to the first one in the grid.
- A pure gambler plays games with NEGATIVE expected value because he WANTS volatility and wants to MAXIMISE the feeling of vertigo
- A professional plays games with POSITIVE expected value, DISLIKES volatility and wants to MINIMISE the feeling of vertigo.
Matching motivation to the activity
All four motivations make sense. But the motivation should true up to the activity. If you are not being honest about this, it will end badly for you.
a. Excitement
You should look for a game in which you minimise your negative expected value. Then you will be able to play for longer. The dangers of gambling addiction are a massive negative impact on your life.
b. Adding interest
If you like doing it, it seems easy to self-manage. The mistake would be to pretend this is your motivation but, if you are honest, it’s more the excitement of a. This could be a gambling problem in disguise and you need to ensure you do not gamble more than you can afford.
c. Adding volatility
It is a useful skill to recognise how and when you should add volatility to what you are doing. Sometimes in a limited sense it looks risky but when you see the bigger picture it is a very logical approach.
d. Making a profit
People who enjoy playing games of skill and are emotionally able to handle short-term volatility, will enjoy and may excel at.
It is possible that with this motivation you could be seen playing high stakes poker against better players. Your motivation however must be to learn, improve and develop your skill level so that your long-term expected value becomes positive. Other motivations such as you think you are going to win, are likely to be become expensive losses to you.
I described earlier how people commonly think that excitement a. motivates the people in my profession. I also meet plenty of students who love gambling and so want to become a trader. But people like this do not succeed as this is the wrong objective.
For trading and investing, the objective is positive expected value and you want to minimise excitement (volatility). In addition, your desires will likely overwhelm your ability to make profitable decisions.
Conclusion
People engage in activities with uncertain outcomes for very different reasons. If you assume that other people are doing them for the same reasons you are you may be making a big mistake. You need to make sure that your motivations match well with the games you are playing.